
18 — The doctor's report in the app: time in ranges, average, GMI, variability
Esta página aún no está disponible en tu idioma.
2026-10-17 · investigation report · JVM renders of the real code (Robolectric native graphics), Sukrara for Mac renders, unit tests
LibreView’s report for the doctor (the AGP page) sums up a period in a few numbers with goals next to them. The user wants the same numbers in Sukrara, in the app and in the widgets: for example GMI in the third slot of a widget, where a 30-day time-in-range ring would otherwise go, faded or at full strength.
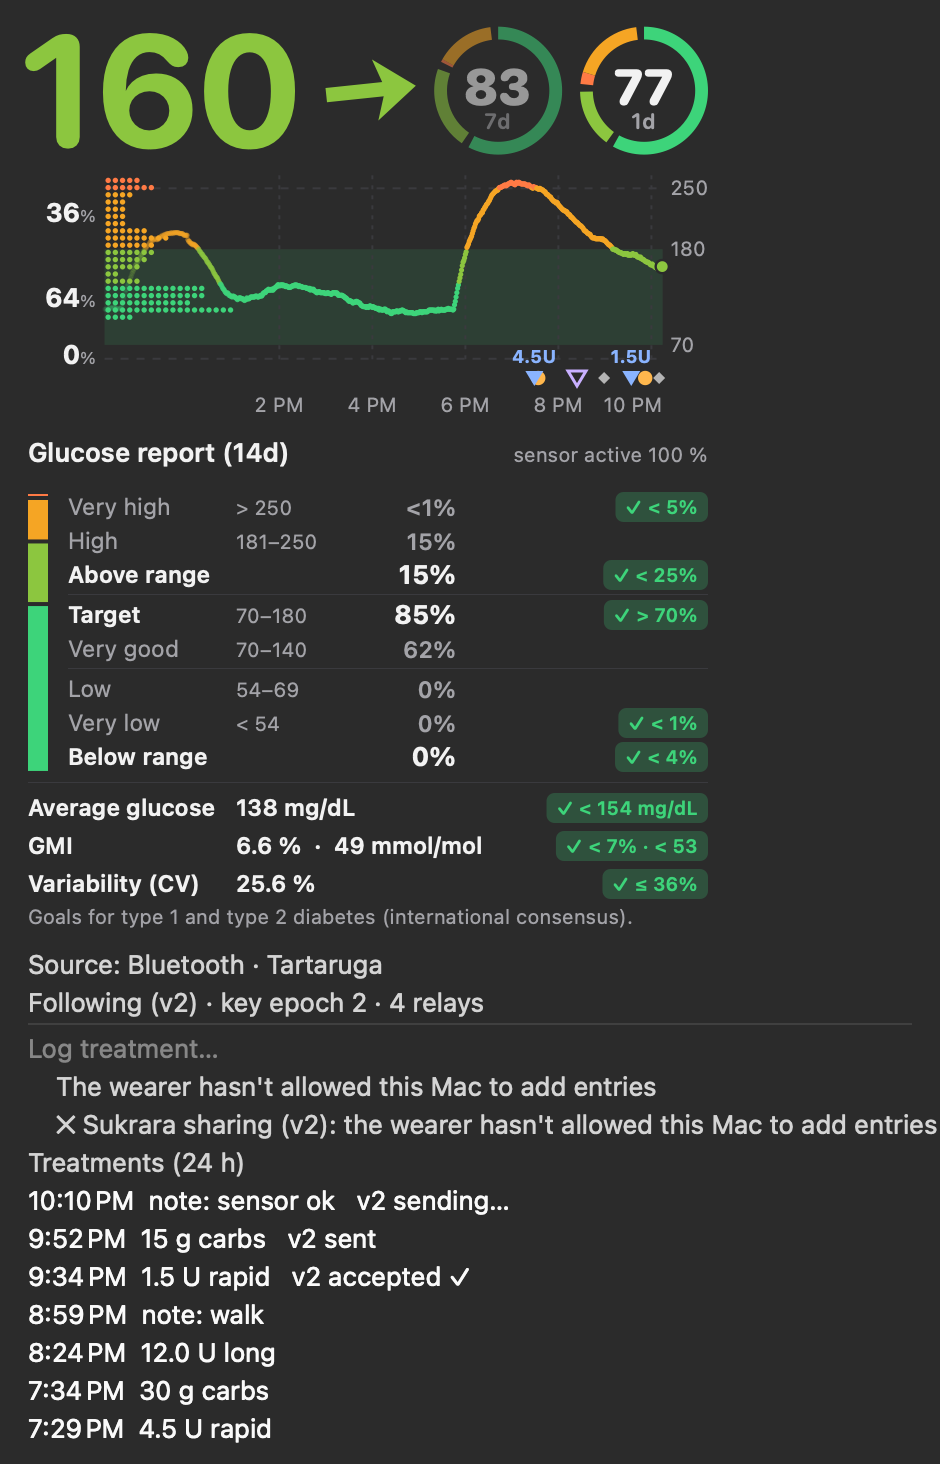
LibreView’s page has two panels: Time in Ranges (a stacked bar from very low to very high with the share and goal of each range, very high + high and low + very low summed against their goals) and Glucose Metrics (average glucose, GMI in % and mmol/mol, glucose variability as % CV, each with its goal). The user’s own page isn’t reproduced here (it’s their health data).
Result
Section titled “Result”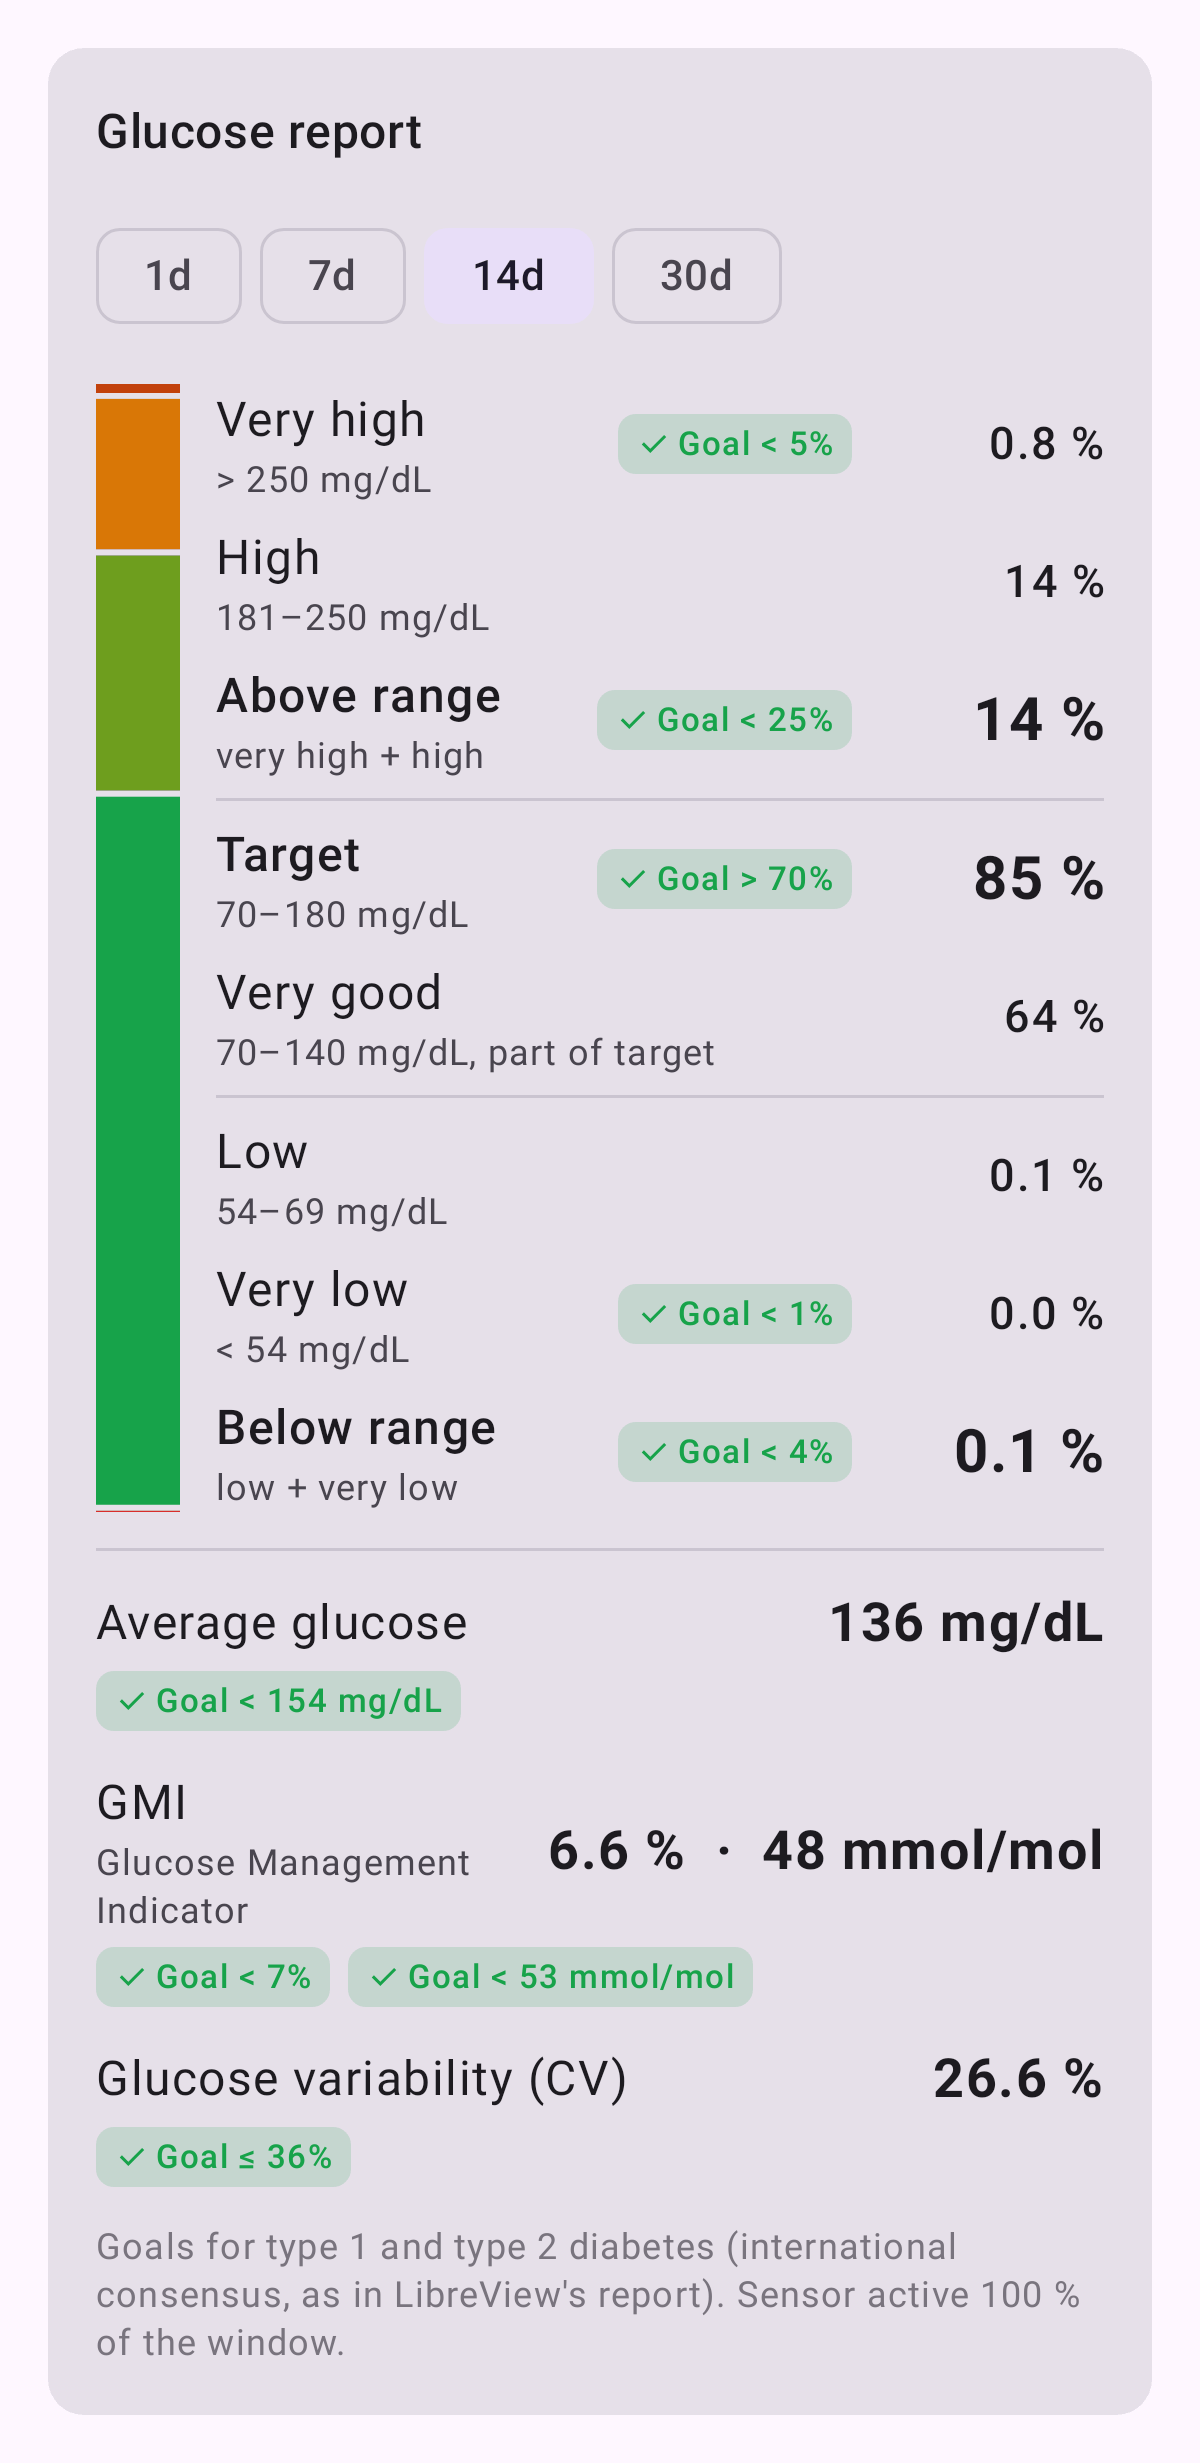 |
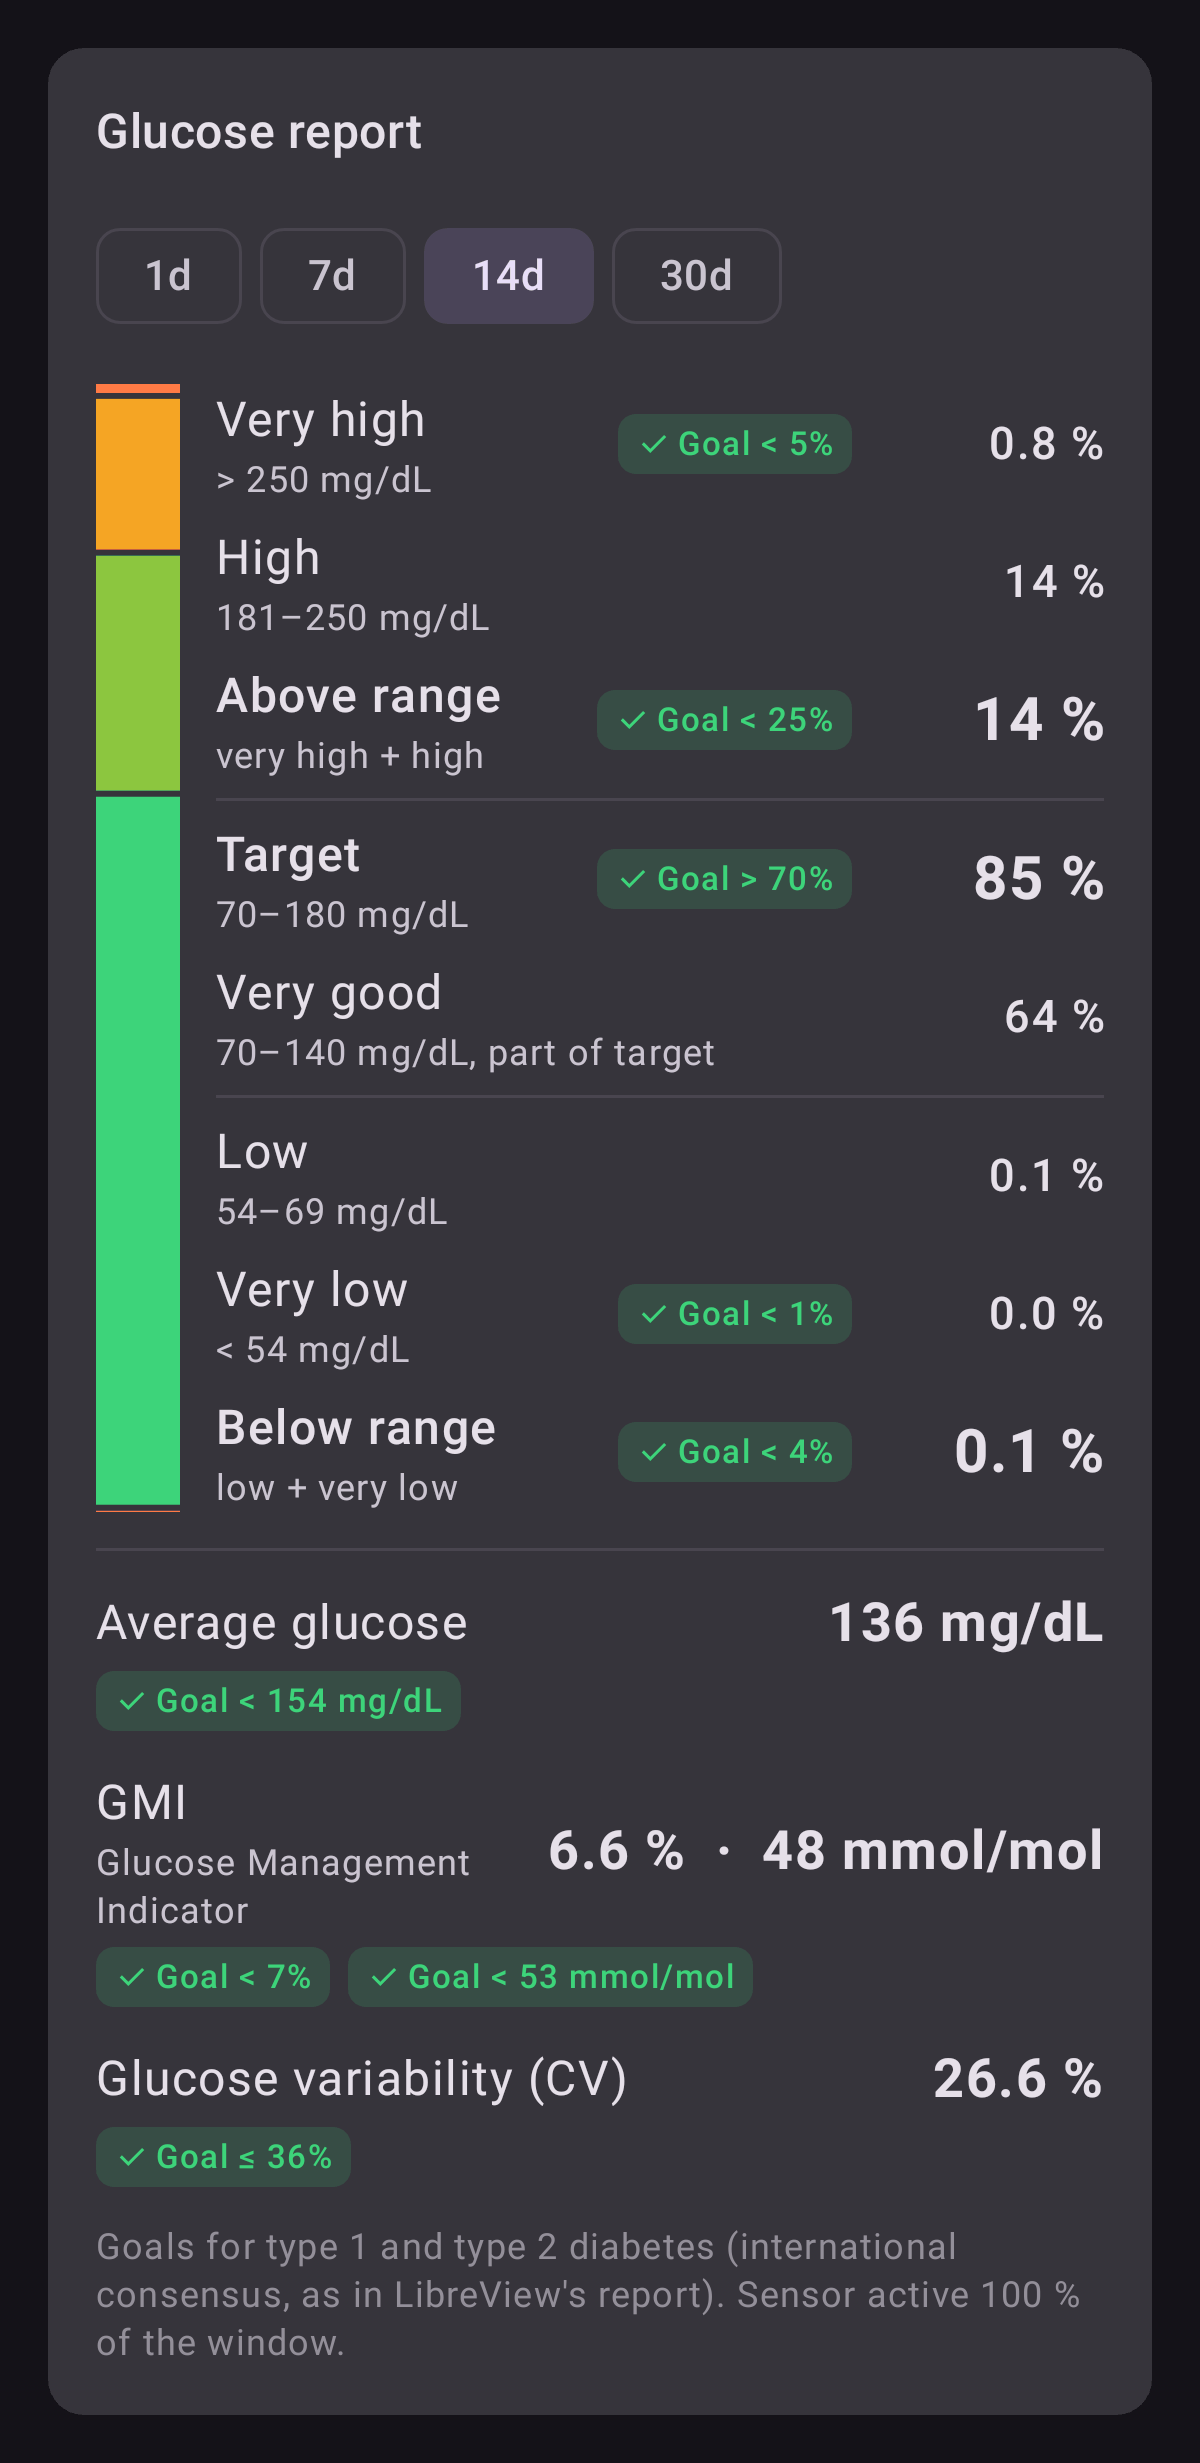 |
The Glucose report card on the home screen (wearer and follower), 14 days by default (1, 7, 14, 30). Synthetic data.
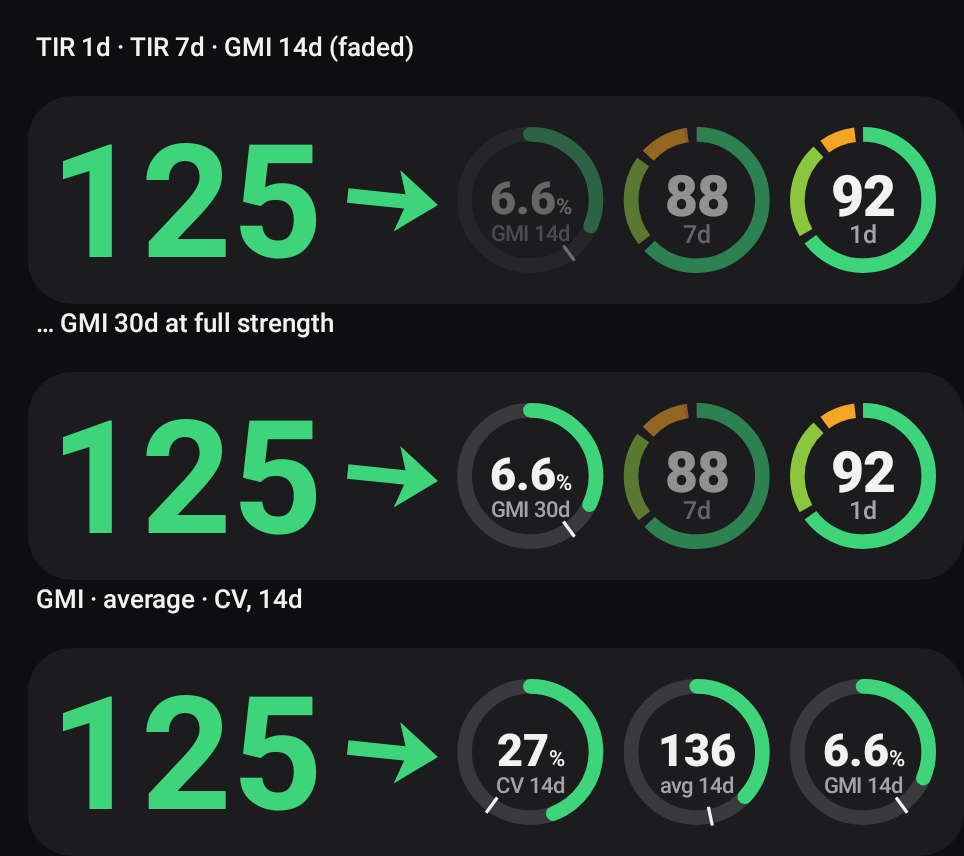
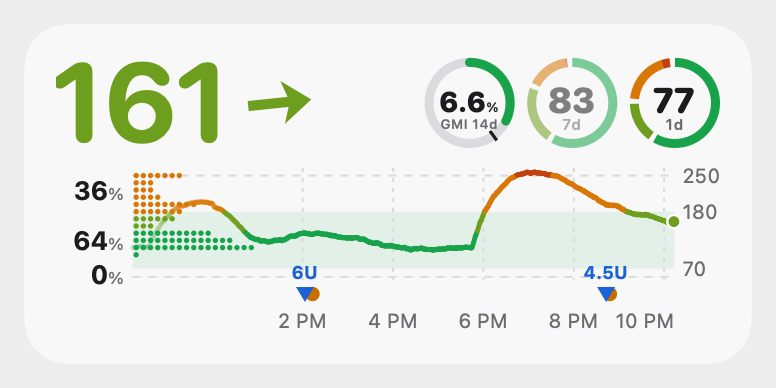
The slots beside the number: a time-in-range ring or a report number (GMI, average glucose, CV) over its own window, faded by position or at full strength. Last row: GMI, average and CV for 14 days.
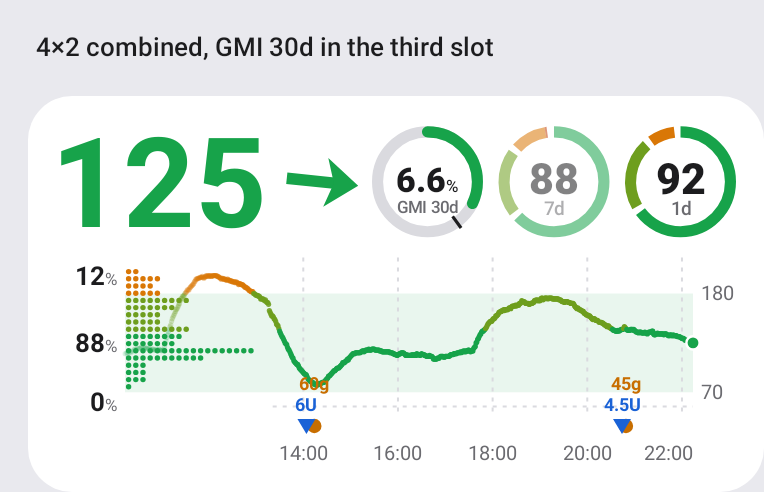
A 4×2 widget with GMI for 30 days in the third slot, at full strength.
| What | How it was checked | Result |
|---|---|---|
| GMI and its units | GlucoseStatsTest.gmi: a steady 141 mg/dL (the report’s average) |
GMI 6.68 % → 6.7 %, 49.5 → 49 mmol/mol, as on the report |
| Mean, SD, CV are time-weighted | GlucoseStatsTest.cvTimeWeighted: one hour at 100 in 1-minute readings, one at 200 in 5-minute history |
mean 150, SD 50, CV 33 % (counting readings would give mean 117) |
| Goals | the consensus targets (below) applied to each number | met = green with ✓, not met = orange |
| Mac | see Mac |
The numbers
Section titled “The numbers”| Number | How | Goal (type 1 and type 2 diabetes) |
|---|---|---|
| Time in ranges | the six bands of 16, every reading weighted by the time it stands for | very high < 5 %, above range (high + very high) < 25 %, target > 70 %, below range < 4 %, very low < 1 % |
| Average glucose | time-weighted mean | < 154 mg/dL |
| GMI | 3.31 + 0.02392 × average (Bergenstal et al. 2018); in mmol/mol: (GMI − 2.152) × 10.929 | < 7 % / < 53 mmol/mol |
| Glucose variability | coefficient of variation: SD / average, time-weighted | ≤ 36 % |
The goals are the international consensus (Battelino et al., Diabetes Care 2019) that LibreView prints as “Goals for type 1 and type 2 diabetes”. The consensus asks for 14 days with the sensor active ≥ 70 % of the time; the card says so when a window has less.
Time-weighting matters here as in 16: the wearer’s history mixes 1-minute live readings and 5/15-minute backfill, and counting readings would let the live minutes outweigh the backfilled hours.
The rings of 16 become slots. Each of the three has:
- a kind: time-in-range ring, GMI, average glucose or CV;
- a window: 12 h, 1, 3, 7, 14 or 30 days (new);
- fainter than the main one: on by default for the second and third; off draws it at full strength.
A report number is drawn as a gauge in the same circle: the value in the middle (“6.6 %”, “136”, “27 %”), the kind and window under it, and an arc on the number’s scale (GMI 5–10 %, average 70–250 mg/dL, CV 0–60 %) with a tick at the goal, green when it’s met. Defaults: 1-day ring, 7-day ring, 14-day GMI as the third (shown when the slot count is 3). Settings → Graph & time in range → Beside the number. The wearer now keeps 31 days of readings (was 15).
The same numbers through the shared Swift renderer (SukraraGraph.swift): metrics, goals, slot kinds and the gauge.
 |
 |
The menubar dropdown: the card, then Glucose report (14d) in the LibreView layout (window in the Graph submenu, reportDays) |
A medium widget with GMI 14 d in the third slot at full strength |
- Slots are
UserDefaultsslots("TIR:86400:1,TIR:604800:1,GMI:1209600:1"), editable per slot (kind, window, fainter) in the Graph submenu. The widget file carries each slot’s numbers precomputed from the Mac’s reading store, which now keeps 31 days.
| File | What |
|---|---|
graph/GlucoseMetrics.kt |
mean, SD, CV, GMI, the goals |
graph/GlucoseCard.kt |
SlotKind, RingSpec.kind/faded, MetricGauge |
graph/GraphSettings.kt, graph/GraphData.kt |
slots setting, cached metrics per window from the role’s store |
ui/ReportCard.kt |
the report card (GlucoseReportContent is pure, so the gallery renders it) |
app/src/test/…/graph/ReportGallery.kt, GraphGallery.slots |
the pictures above |
In Sukrara (0.11.7)
Section titled “In Sukrara (0.11.7)”| Added | Discarded (why) |
|---|---|
| Glucose report card on both home screens (time in ranges with goals, average, GMI % and mmol/mol, CV, coverage note) | the report’s AGP percentile curve and daily profiles (the chart and the time-at-level distribution already show the shape) |
| Slots: ring, GMI, average or CV, each with its window and fade | — |
| 30-day windows; 31 days kept on the wearer | — |