
16 — One glucose graph everywhere: time in range, freshness, rings
2026-10-17 · investigation report · Android 16 emulator (synthetic source), JVM renders (Robolectric native graphics), Sukrara for Mac renders (ImageRenderer)
One improved picture for every place Sukrara shows glucose (app, home-screen widgets, the notification, the Mac menubar and Mac widgets), from the user’s draft:
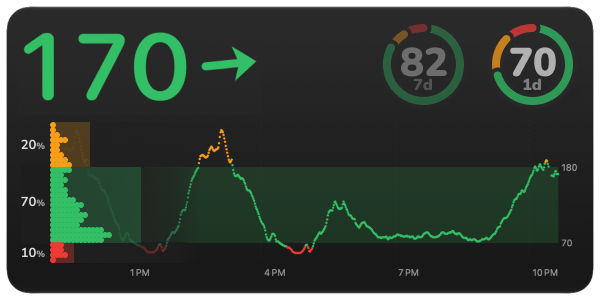
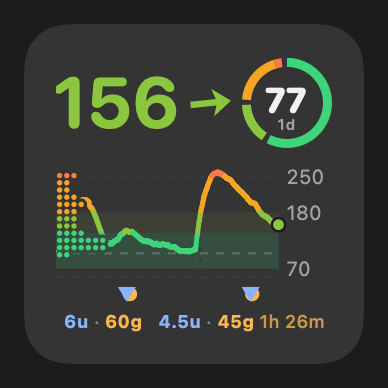
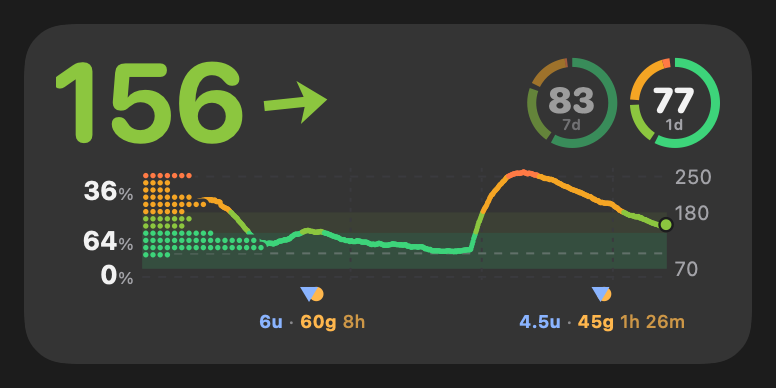
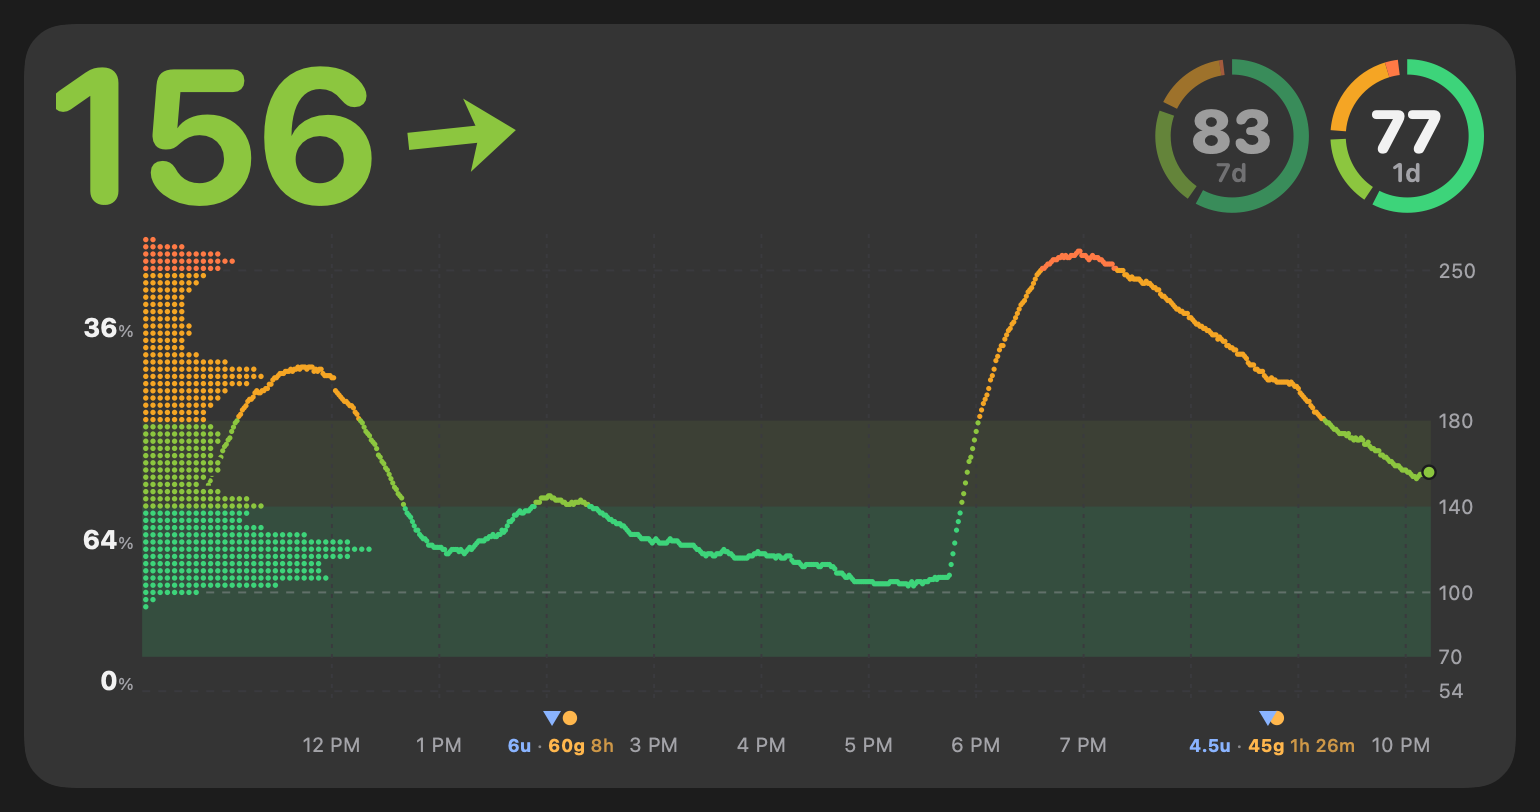
- Distribution on the left of the chart. It grows rightwards from the chart’s left edge and shows how much time was spent at each glucose level over the chart’s window. The lines underneath stop short of its dots (they faded out towards that edge until the cut-out).
- Time in range as soft rectangles. One per major band (high, in range, low), each as wide as its share of time, with the % next to it. A “very good” band (70–140) sits inside “in range” in a second green; very high (> 250) and very low (< 54), the levels of the LibreView report, sit inside high and low.
- No “x min ago”, no “+0.1/min”. A value is assumed current. The older it gets, the less is shown: the reading’s time, then struck through, then no value, then no graph.
- Time-in-range rings. A segmented ring per window (1 day, 7 days…) with the % in the middle, up to three, fading from the main one, hidden when they don’t fit. Window and counted range (“in range” / “very good”) are settings.
- 12 h by default, a default the user can change, an optional window per place, and per-widget settings, so the same widget can be added twice and look different.
- Configurable major ranges.
Result
Section titled “Result”It works. One renderer draws the whole card on a plain Android Canvas. The app (Compose’s native canvas), the
three widgets and the notification (bitmaps) all use it, and the Mac has a line-for-line Swift port. The same code
renders the picture sheets below on the JVM, so the report pictures are the real thing.
 |
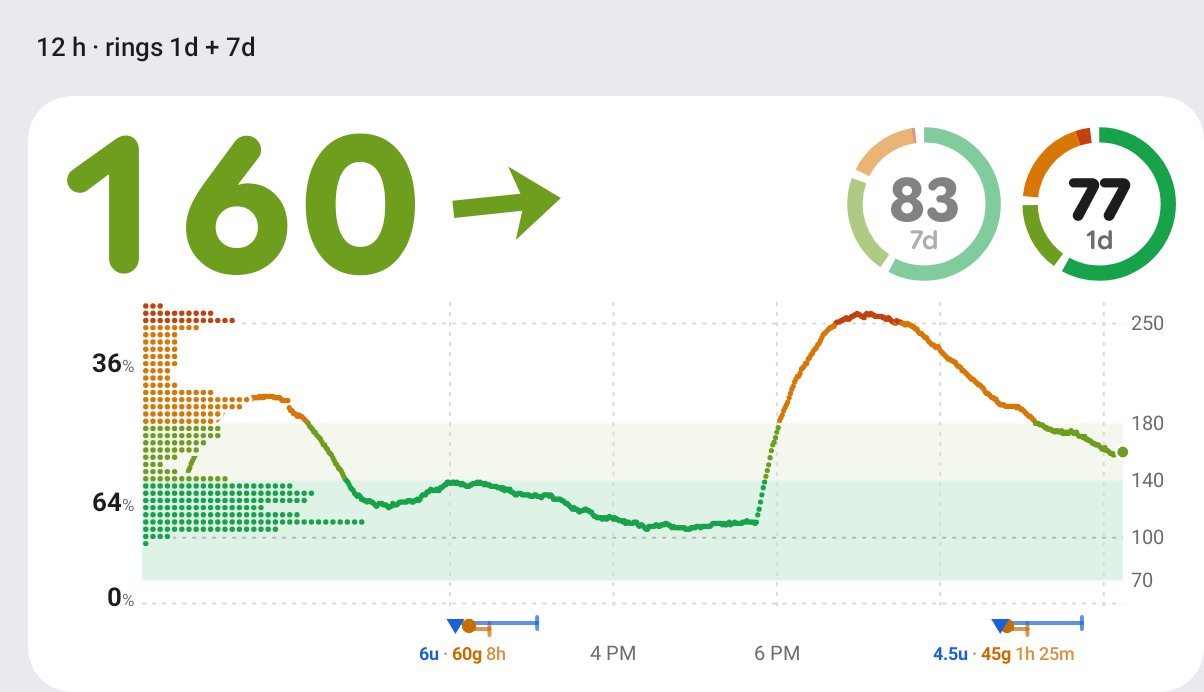 |
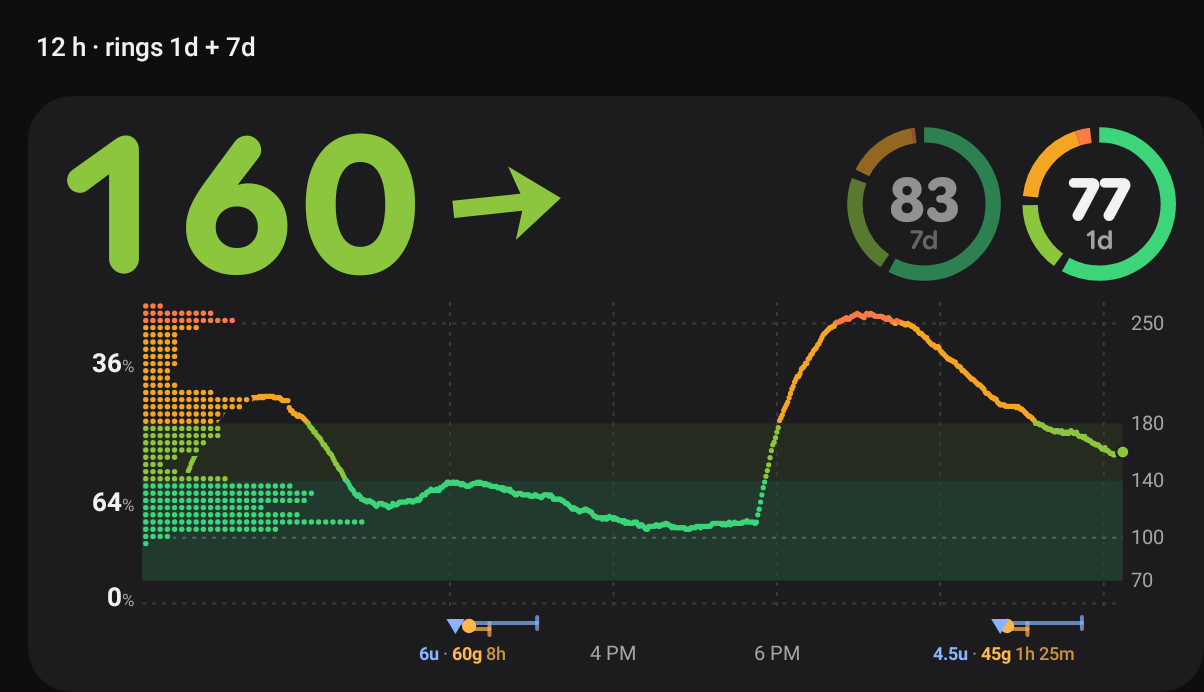
12 h chart, distribution as rows of dots (like the line), % of time below / in / above range, rings for today and the last 7 days (the main ring on the right, the second faded). Synthetic two-week history with meals, a dawn rise and afternoon dips.
| What | How it was checked | Result |
|---|---|---|
| Renderer on Android | GraphGallery (Robolectric native graphics) draws all sheets; emulator (release build): app, settings, widget Reconfigure screen, combined widget on the launcher |
same picture on the JVM and on the device |
| Statistics | GlucoseStatsTest: six bands, time weights with 1- and 5-minute data, gaps, band-exact areas = time in range, % add up to 100, freshness steps |
6/6 pass (one real bug found and fixed: the last reading of 5-minute history was under-counted) |
| Freshness steps | sheet with readings 30 s, 3 min, 12 min, 75 min, 5 h old; emulator (a late reading showed its time) | as designed, see Freshness |
| Rings over days | wearer keeps 15 days in owner.db now; rings computed from the store, cached 5 min |
1d ring on the emulator (24 h of synthetic data; the 7d ring stays hidden until a quarter of its window has data) |
| Per-widget settings | widgetFeatures="reconfigurable|configuration_optional" + WidgetConfigActivity |
a new widget follows the app settings; touch & hold → Reconfigure changes only that one |
| Mac | see Mac |
The distribution: which algorithm?
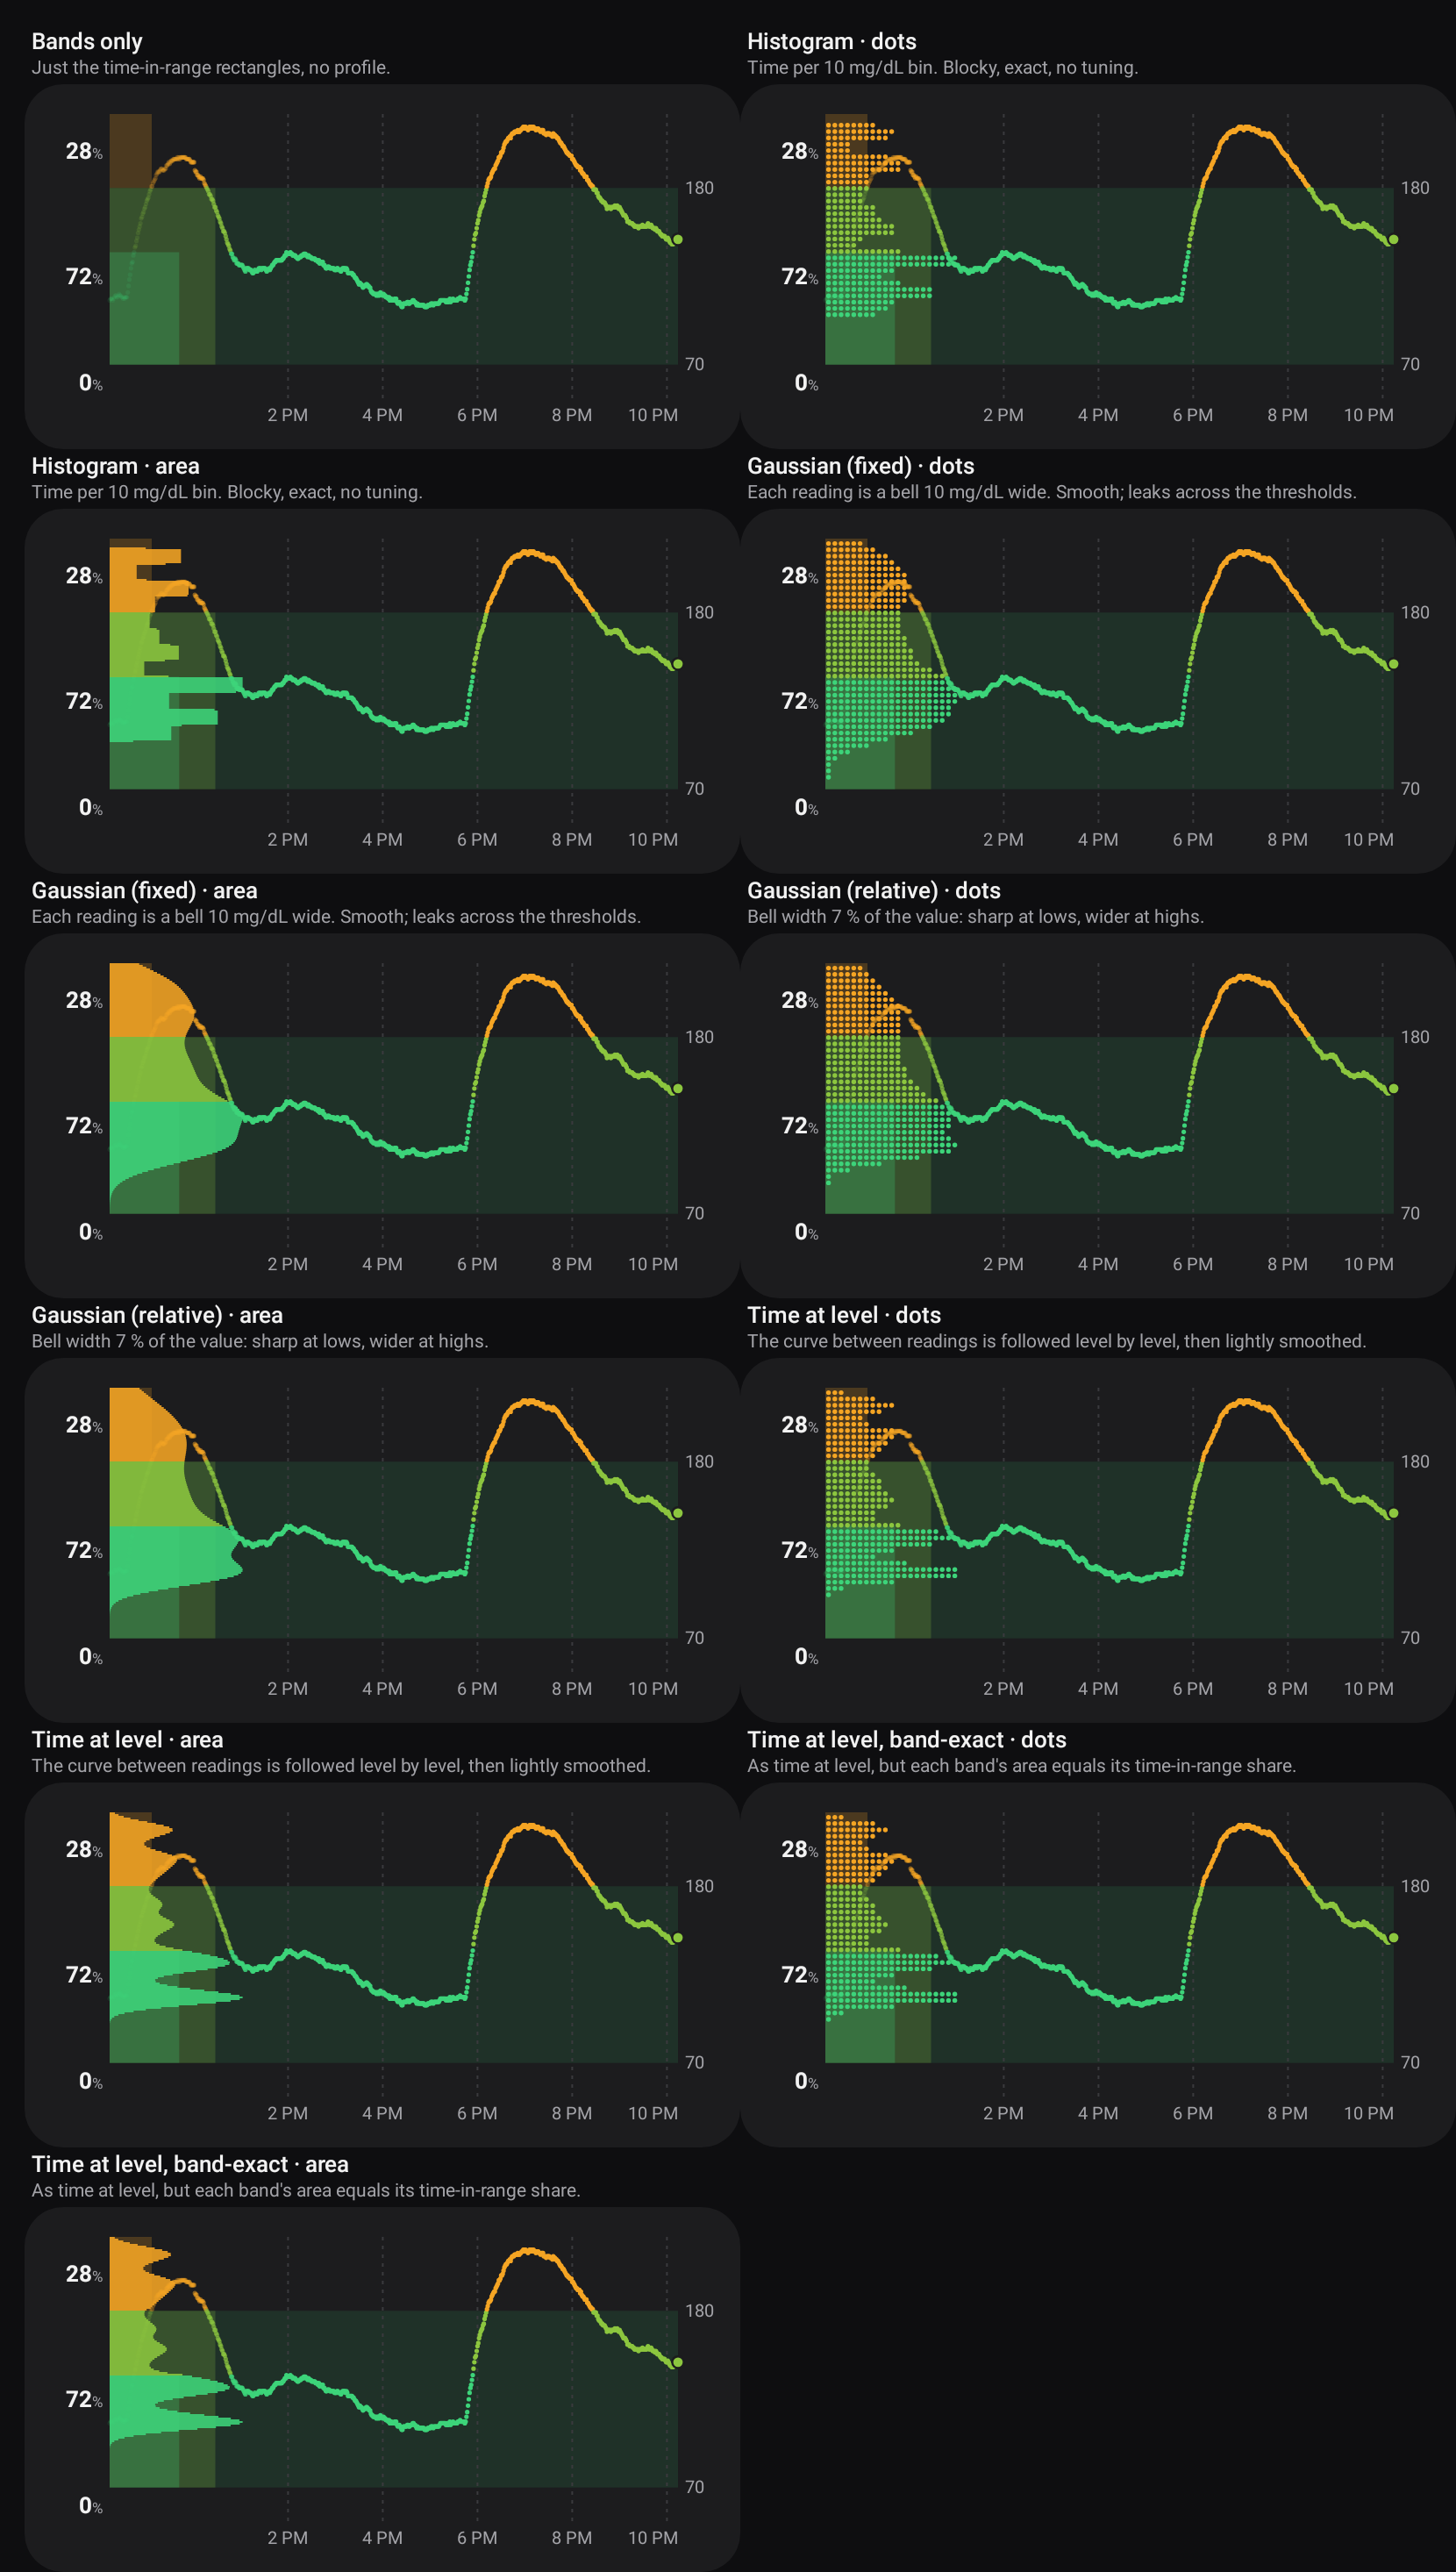
Section titled “The distribution: which algorithm?”There’s no single right way to turn readings into “time at each level”, so six options were built and shown to the user side by side. All of them weigh every reading by the time it stands for (until the next reading, at most 15 min), so 1-minute live readings and 5/15-minute backfilled history count the same per hour, and a gap counts as nothing.
| Option | How | Good | Bad |
|---|---|---|---|
| Bands only | just the rectangles | calm, nothing to explain | no shape inside a band |
| Histogram | time per 10 mg/dL bin (the user’s “count per band”, finer) | exact, no tuning | blocky; a 10 mg/dL step is coarse at lows |
| Gaussian (fixed) | each reading is a bell 10 mg/dL wide (the user’s “gaussian” idea) | smooth | leaks across thresholds: a band’s area ≠ its % |
| Gaussian (relative) | bell 7 % of the value (5 mg/dL at 70, 13 at 180), i.e. a kernel in log-glucose | sharper at lows, smooth at highs | same leak |
| Time at level | the curve between two readings is followed level by level (each mg/dL it passes gets its share of the time), then smoothed 4 mg/dL | the most literal answer to “how long was I at 150?” | a long flat stretch makes a tall spike |
| Time at level, band-exact | as above, then each band is rescaled so its area equals its time-in-range share | the shape and the % labels can never disagree | small steps at the thresholds |
Each could be drawn as rows of dots (like the draft and the line) or as a filled area.
Decision (the user, 2026-10-17): time at level, band-exact, as dots. The other five and the area style were removed from the code; the only switch left is the distribution + % on or off (app-wide and per widget).
Rectangles removed (the user, 0.11.9): the time-in-range rectangles behind the dots (as wide as each range’s share) cluttered the chart. The % labels and the dots carry the same information; the rectangles are gone from every surface. The pictures in this report show the current design, except the options comparison above and the menubar dropdown.
Freshness
Section titled “Freshness”| age of the latest reading | value | reading’s time | graph | |
|---|---|---|---|---|
| fresh | ≤ 90 s | ✓ | – (no “now”: #181) | ✓ |
| late | ≤ 5 min | ✓ | ✓ (“10:11 PM”) | ✓ |
| stale | ≤ 20 min | struck through, grey, no arrow | ✓ | ✓ |
| old | ≤ 3 h | – (“No reading since 8:59 PM”) | ✓ | ✓ |
| gone | older / none | – | ✓ | – (rings stay) |
90 s, not 60: readings come every minute, so one a few seconds past a minute is still on time. 20 min is when the “no data” alert fires. A clock time instead of “3 min ago” also means a fresh widget never redraws just to tick.
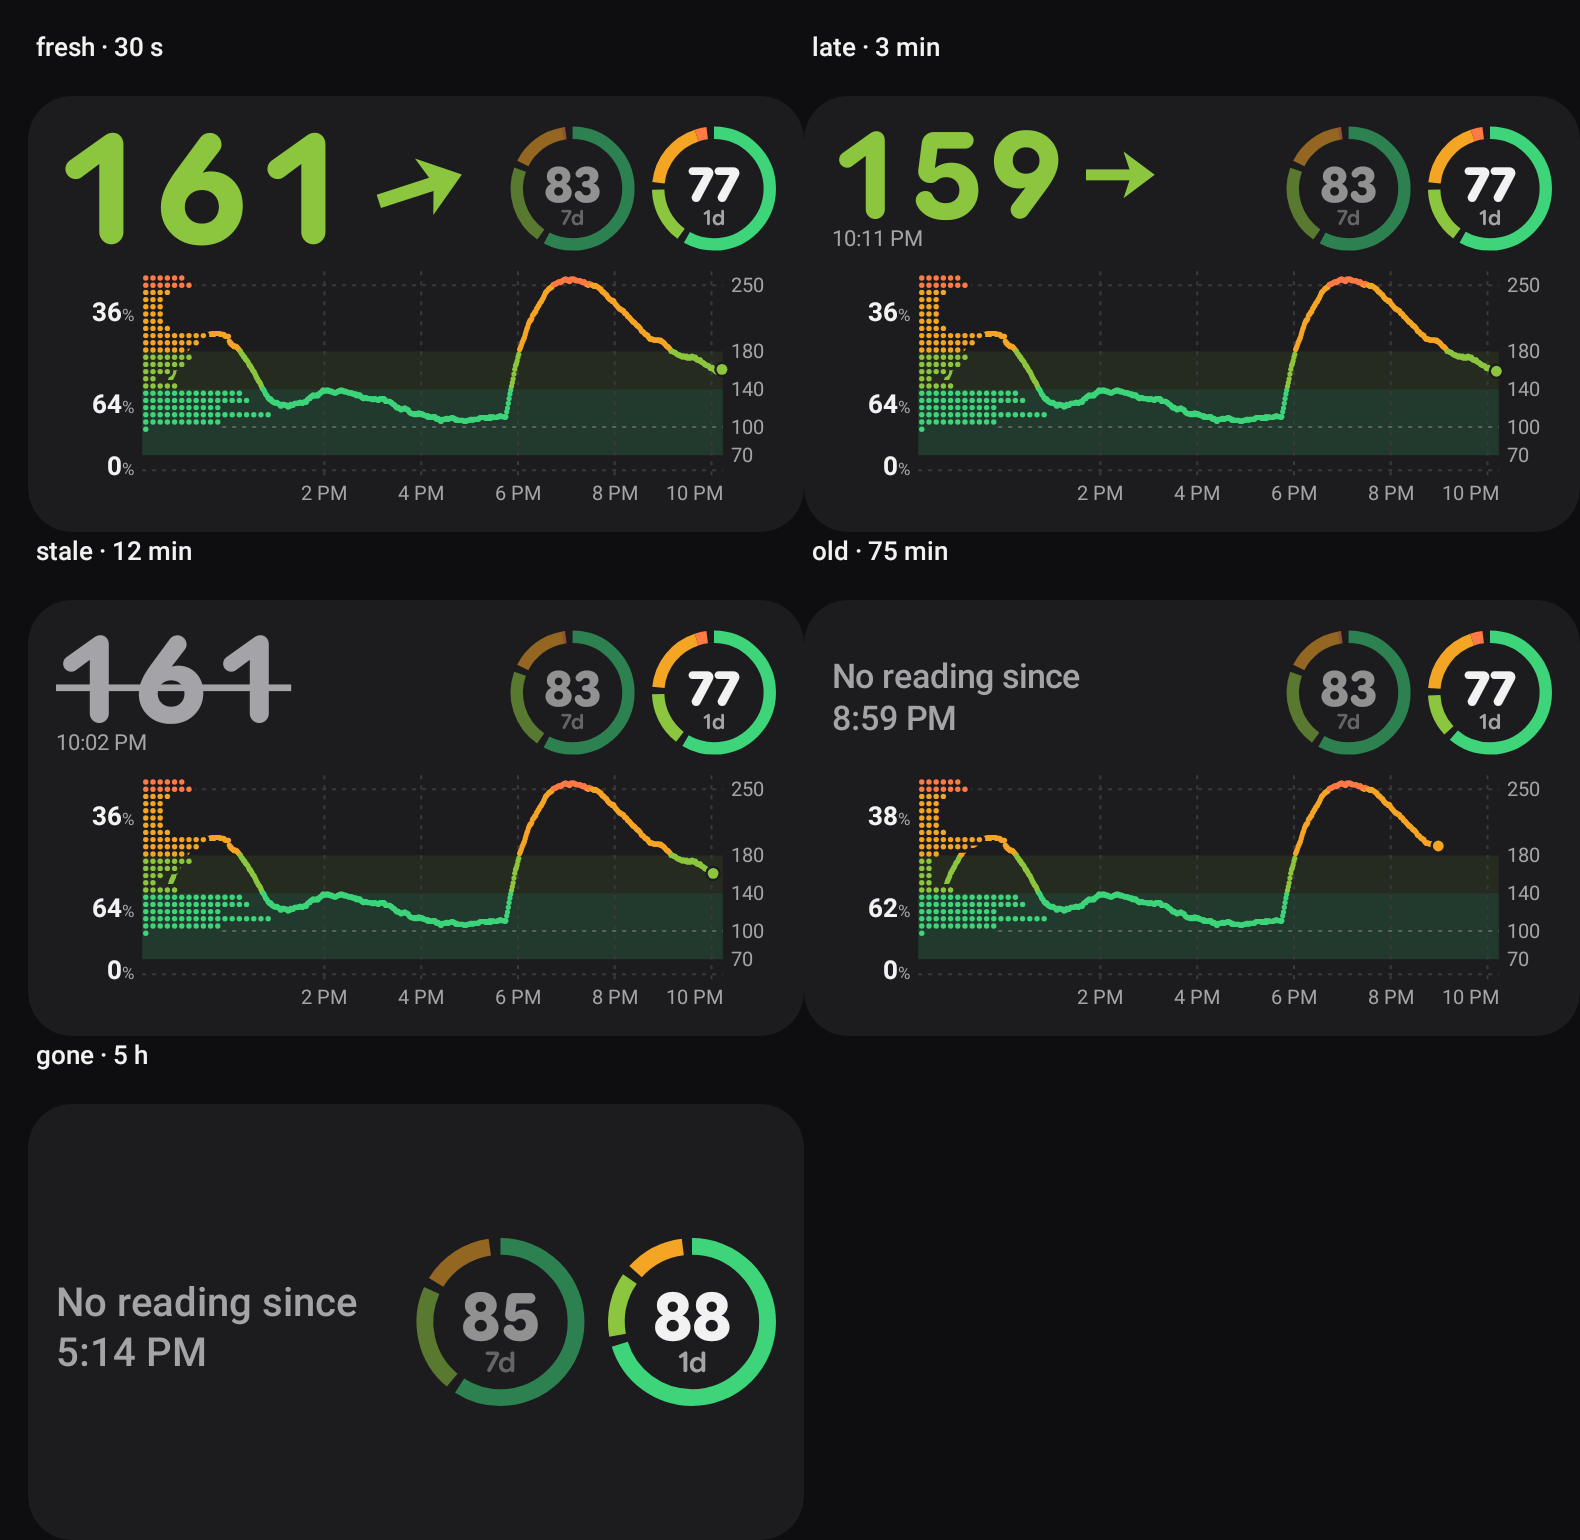
Applied everywhere: app panel, widgets, notification (title “No reading since …” when old; no rate, no age while fresh; the Live Update card’s metrics are value + arrow, plus the reading’s time when late), Mac menubar.
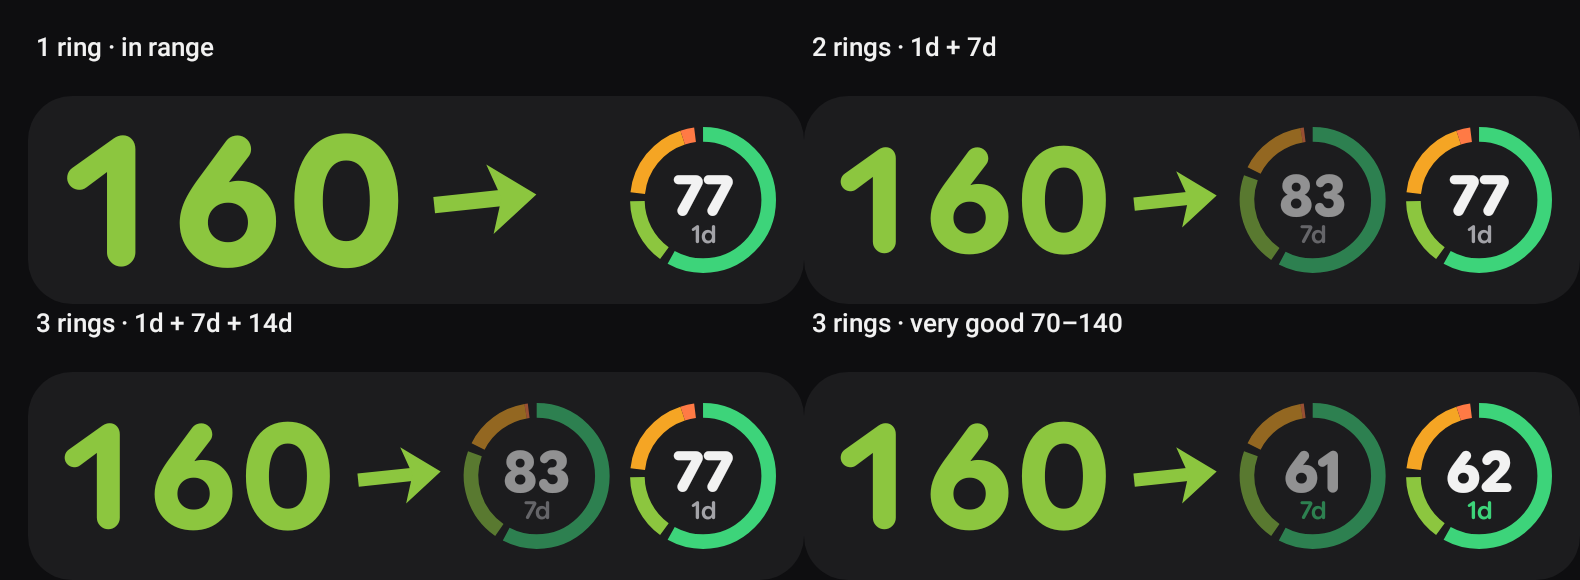
- Segments clockwise from 12 o’clock, by default (the user, 0.11.9): very good, in range, low, very low, high, very high. In range starts at the top, the lows follow, then the highs, very high last. The order is a setting (Android: Settings → Graph → Ring order, ↑/↓ per segment; Mac: Graph → Ring order). Gaps between below, very good, in range and above; the two lows and the two highs touch.
- The middle shows the chosen range (default in range; “very good” puts the window label in the very-good green).
- 0–3 rings, each with its own window (12 h, 1d, 3d, 7d, 14d); defaults 1d + 7d (+14d as the third). Main ring on the right at full strength, then 55 %, then 35 %.
- A ring needs data for at least a quarter of its window; otherwise it’s not drawn. The wearer now keeps 15 days of readings (was 8) so 14d works; a follower keeps what it received (relays hold a week).
Sizes and per-widget settings
Section titled “Sizes and per-widget settings”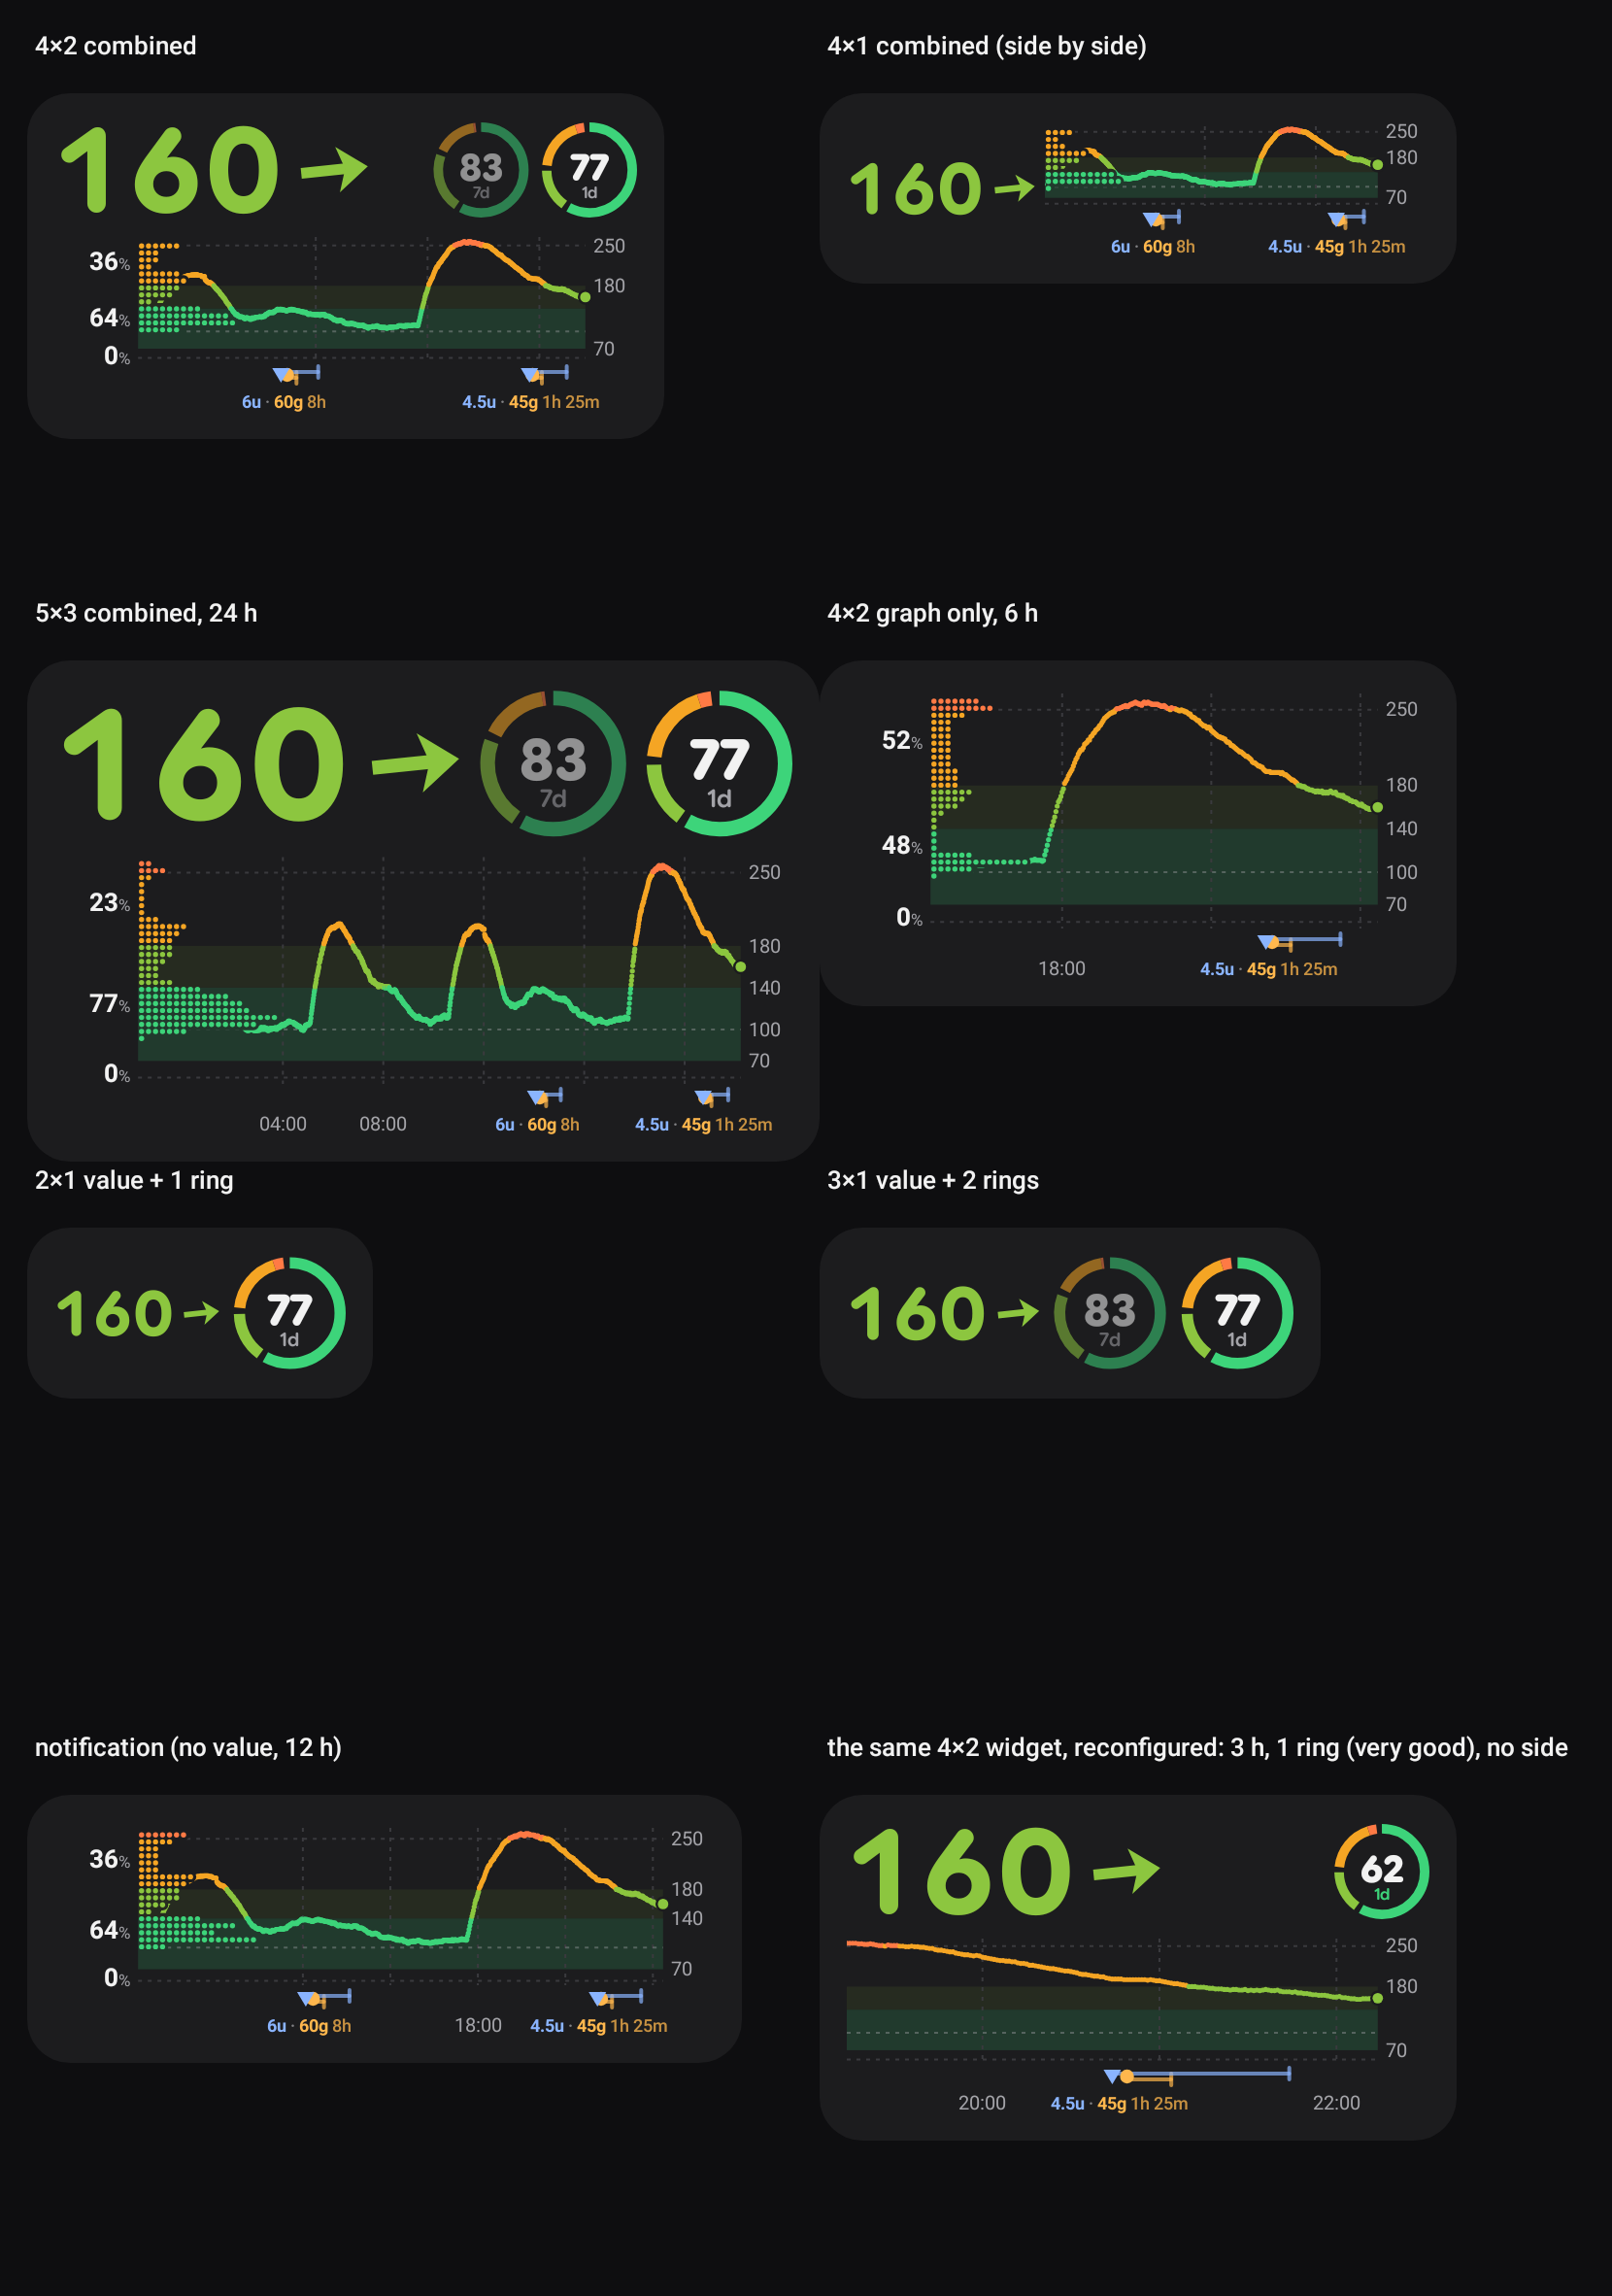
- The three widgets now draw the same card at the real pixel size of each placement (value: number + rings; graph: chart; combined: all). Short wide placements put the value beside the chart; rings that don’t fit go.
- Per widget: Android widgets are configured per placement (
android:configure+widgetFeatures="reconfigurable|configuration_optional", per the Glance configuration guide). A new widget needs no setup and follows the app; touch & hold → Reconfigure opens a screen with a live preview at that widget’s size: window, number of rings, counted range, distribution on/off. The last tile above is the same 4×2 widget reconfigured to 3 h, one “very good” ring, no distribution. - Windows: one default (12 h), optionally one per place (app, notification, widgets), and per widget.
Ranges
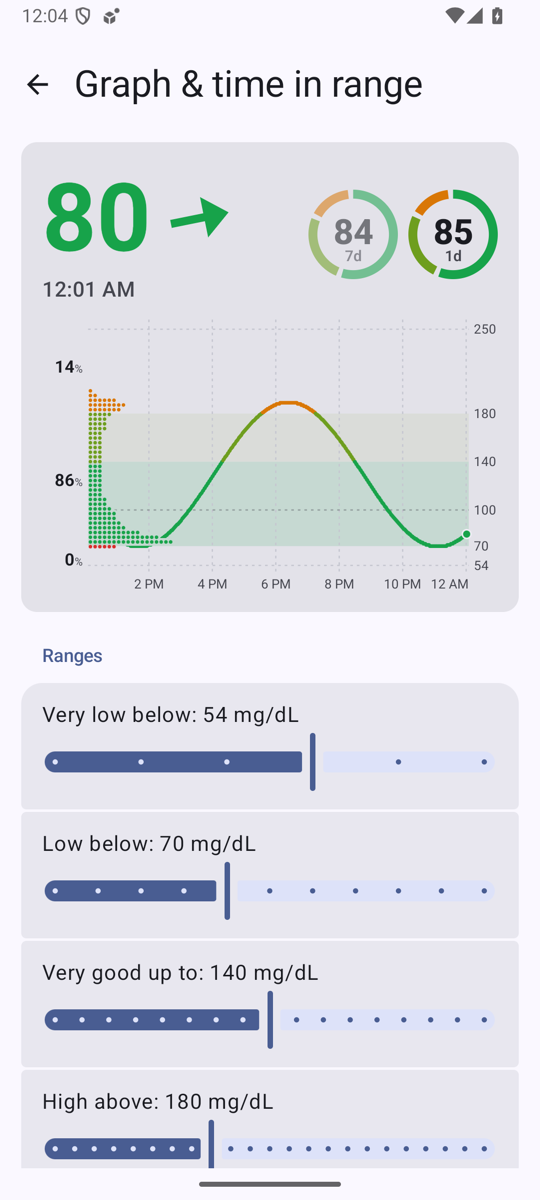
Section titled “Ranges”Very low below 54, low below 70, very good up to 140, high above 180, very high above 250 (Settings → Graph & time in range, 5 mg/dL steps), the same levels as LibreView’s report for the doctor. They replace the old colour thresholds 65 / 145 / 185 everywhere: the number, the line, the rings, the status-bar colours (the LSPosed hook gets them in its state broadcast) and the notification’s semantic style (below = danger, above = caution). Above range is now orange (very high a deeper red-orange), as in the draft; it was red above 185. Alert thresholds are separate (investigation 15) and unchanged.
- Extremely high (300 by default, the extremely high alert’s level; the alert keeps its own setting) turns the line, the distribution and the number magenta. Time in range still has LibreView’s five ranges.
- In the chart, very high / very low get a faint dashed line, and so do the user’s own lines (100 by default, drawn a little stronger). The y axis always reaches 54 and 250, even on a day that stays between 70 and 220; the user’s lines don’t change the zoom (a line outside the range isn’t drawn). The very good part of the in-range band has its own colour. The values on the right: 70 and 180 always, then 140, 54 / 250 and the extra lines, each only where it doesn’t touch one already written.
- The three % labels are above / in range / below (the rectangles described in the goal were removed in 0.11.9). Labels too close for their bands are pushed apart.
- The ring has six segments; gaps only between below, in range and above.
On the device
Section titled “On the device”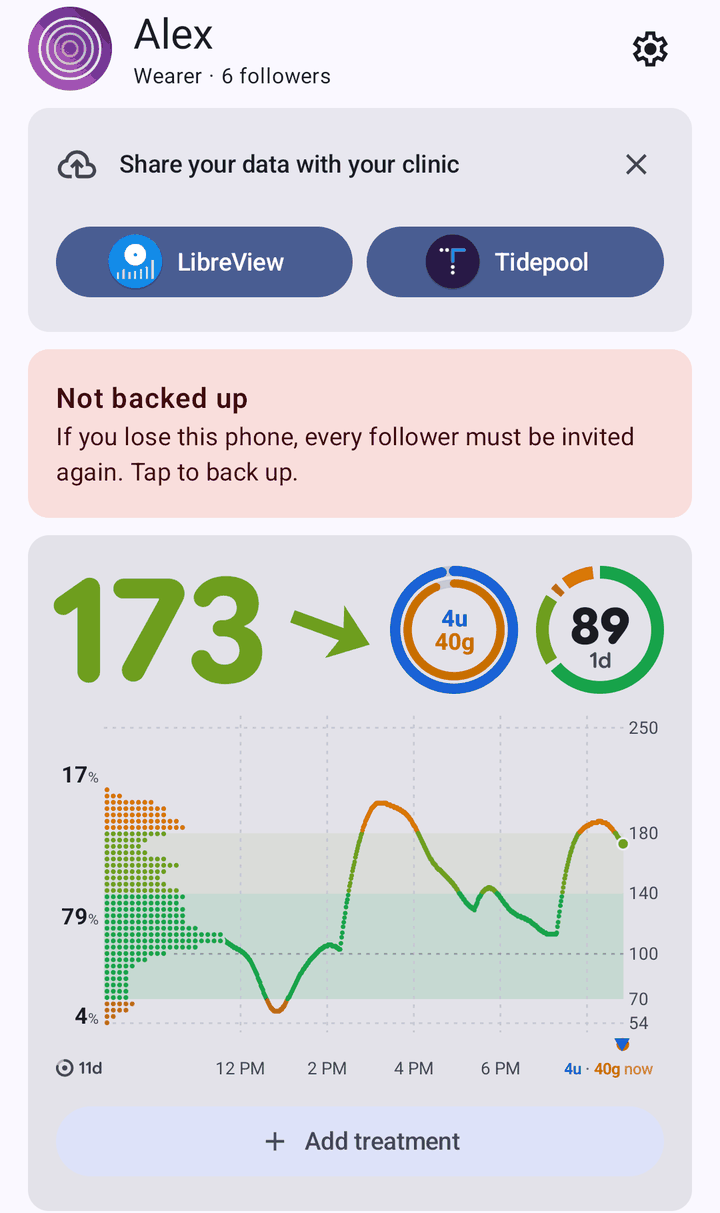 |
 |
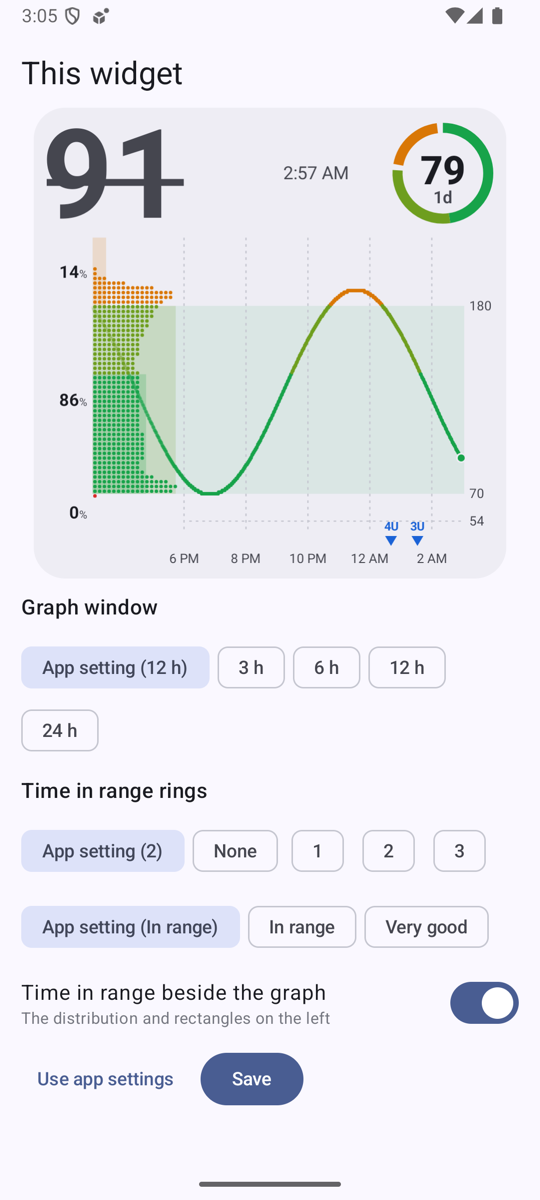 |
| App home (0.11.13, synthetic source on the emulator) | Settings → Graph & time in range: live preview, the ranges as sliders | A widget’s own settings (touch & hold → Reconfigure), preview at that widget’s size |
The emulator ran under very heavy host load (load average 30–46 from parallel sessions); its “isn’t responding” dialogs came from Android’s render thread and system server, not from Sukrara (main-thread stack checked).
The same renderer, ported line for line to Swift + CoreGraphics in one shared file
(poc/spikes/widgets-macos/Shared/SukraraGraph.swift) that both the
menubar app (a symlink in its SwiftPM target) and the widget extension compile. Same ranges, weights, six
algorithms, freshness steps, colours and layout.
 |
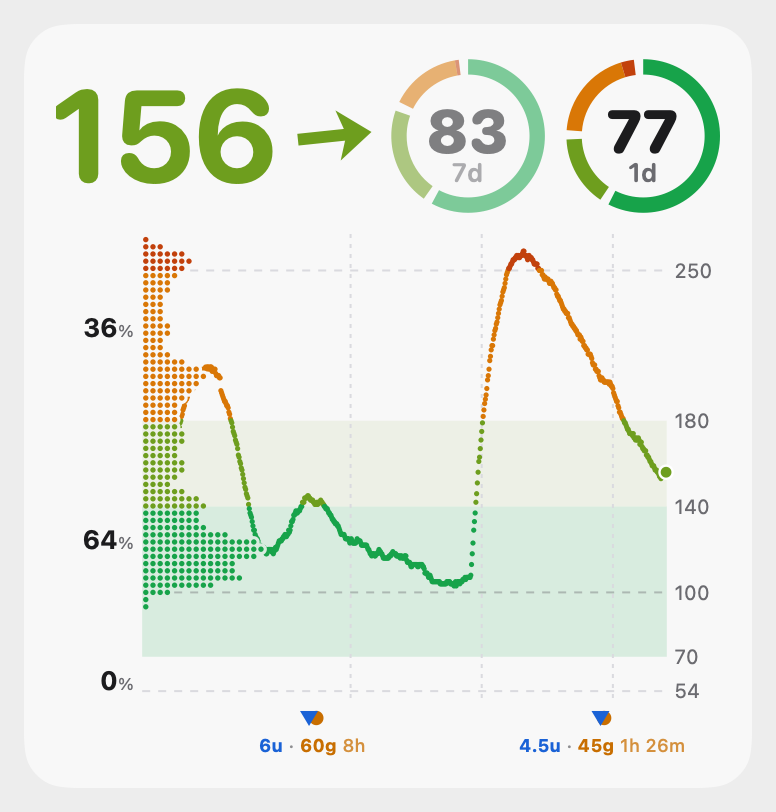 |
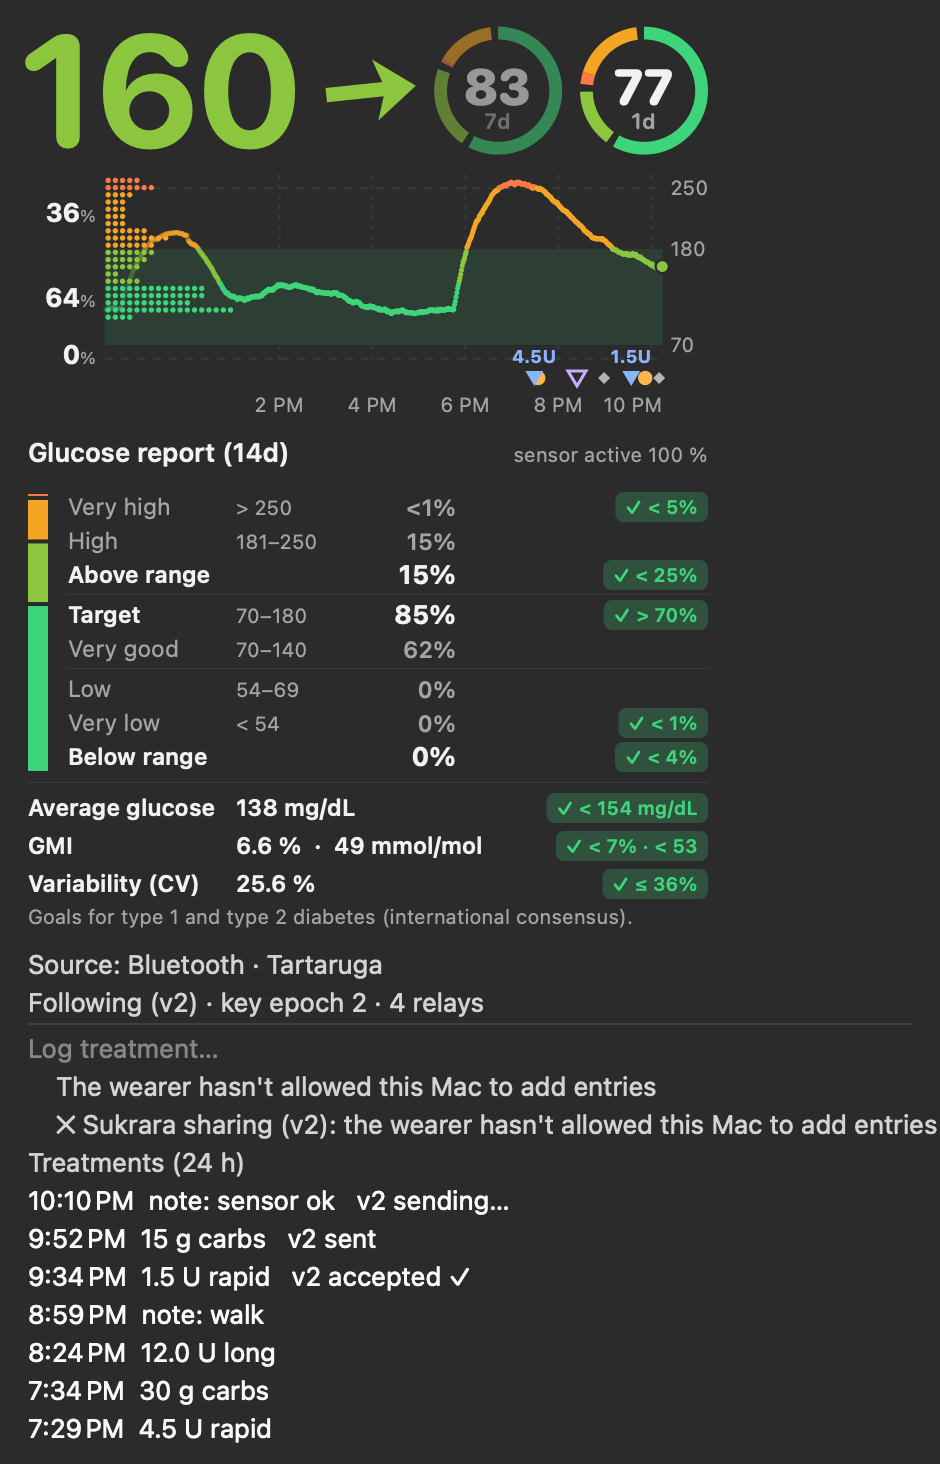
| Menubar dropdown: the card (12 h) replaces the 3 h sparkline and the “x min ago / rate” lines; treatments as before | Large widget, light |
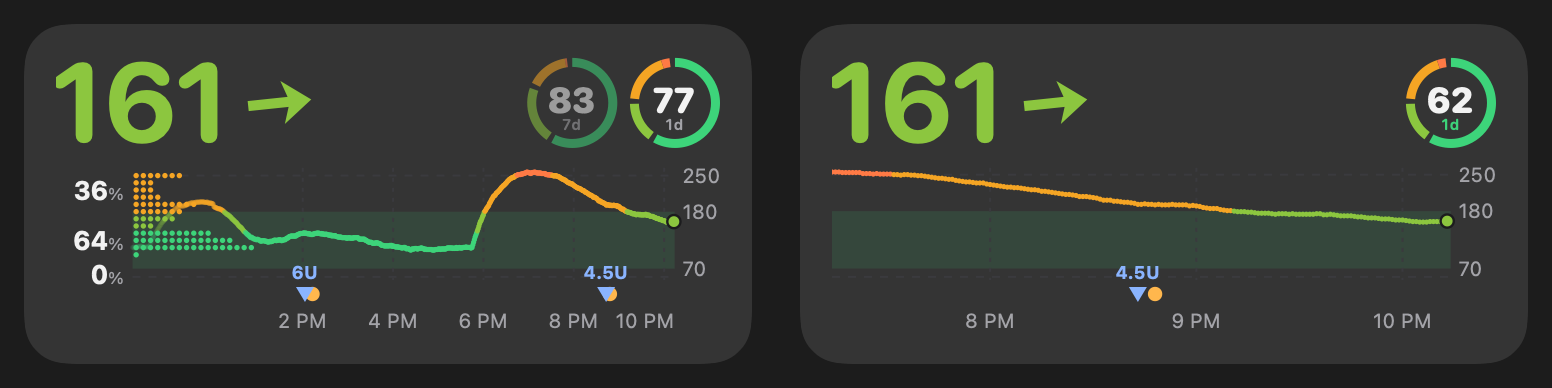
The per-widget settings render (left: app settings, right: its own) from 0.11.7; on the real desktop they never worked and were removed in 0.11.8, see below.
- Menubar number: red below range, orange above, normal ink in range (the fixed 65/145/185 are gone); struck
through when stale, “–” from 20 min. A Graph submenu sets window, rings, the ring’s range and the distribution on/off.
Settings are
UserDefaults(graphHours,menubarHours,widgetHours,ringCount,ringWindows,ringRange,bandVeryLow/bandLow/bandTight/bandHigh/bandVeryHigh,side). - History for the rings: the Mac kept 3 h (menu) / 12 h (widget feed). A small store
(
~/Library/Application Support/Sukrara/readings.csv, every reading merged ±20 s, 15 days) now feeds the rings. - Widgets: the widget file (v2, replaces v1) carries the graph settings, 24 h of readings and the ring numbers precomputed from the store, so the sandboxed extension needs no database. The timeline adds an entry at each freshness step.
- Per widget on macOS: tried and removed (0.11.8). 0.11.7 gave the widgets App Intents settings (“Edit
Widget”), with the intent metadata generated by Xcode’s
appintentsmetadataprocessorbecause the widget is built without an Xcode project. chronod never registered the intent: it asked for every timeline withintent = nil, and WidgetKit rejected each one (CHSErrorDomain 1103 "Intent configuration is required but was not provided"), so the user’s widgets froze on their last picture. The widgets are a static configuration again; the window comes from the Graph submenu (widgetHours).
| small | medium | xl |
|---|---|---|
 |
 |
 |
| File | What |
|---|---|
graph/GlucoseStats.kt |
bands, time weights, time in range, the six distribution algorithms |
graph/Freshness.kt |
the five freshness steps, the reading’s time text |
graph/GlucoseGraph.kt |
the chart: bands, level lines, line, distribution (cut out of the lines), labels, treatments |
graph/GlucoseCard.kt |
ring + whole card layout (value, arrow, badge, slots, chart) |
treatments/TreatmentMarks.kt, graph/TextModel.kt |
treatment markers, mute lines, the label layout (below) and its width model |
graph/RoundedFont.kt, assets/fonts/ |
the rounded face of the card’s numbers (Google Sans Flex, ROND 100) + its OFL licence |
graph/CardStatus.kt, treatments/LastTreatment.kt |
status badge, last-treatment slot, slot priority (2026-10-18) |
graph/GraphSettings.kt, graph/GraphData.kt |
settings (app-wide + per widget), multi-day time in range from the role’s store |
ui/GraphScreen.kt, ui/Widgets.kt (GlucosePanel), widgets/Widgets.kt, widgets/WidgetConfigActivity.kt, status/GlucoseNotification.kt |
the surfaces |
app/src/test/…/graph/GraphGallery.kt |
the picture sheets (GALLERY_JAVA_HOME=<JDK 21+> ./gradlew testDebugUnitTest --tests '*GraphGallery*' -Dgallery.out=…) |
Robolectric’s Android 16 sandbox needs Java 21+; the build keeps JDK 17 and runs the unit tests on
GALLERY_JAVA_HOME when it’s set (tested with JDK 27 + Robolectric 4.17 + ASM 9.11).
DebugReceiver: --es graph '{"profile":"KDE_LOG","defaultHours":6,"ringCount":3}' (any GraphConfig field),
--es widgetGraph '<id>:{"hours":3,"rings":1,"side":false}', --es cmd pinWidget --es kind value|graph|combined
(asks the launcher to add a widget; the app must be in the foreground).
In Sukrara (0.11.5)
Section titled “In Sukrara (0.11.5)”| Added | Discarded (why) |
|---|---|
| One renderer (Android Canvas + a Swift port) for app, widgets, notification, Mac menubar and Mac widgets | the old per-surface charts: GraphRenderer, GlucoseChart, BigGlucose, the Mac sparkline (replaced outright) |
| Distribution beside the chart: time at level, band-exact, dots | histogram, two Gaussians, plain time at level, the area style (the user picked one) |
| % for below / in range / above | the time-in-range rectangles behind the distribution (0.11.9: the user found they cluttered the chart) |
| Six configurable ranges (54 / 70 / 140 / 180 / 250) | the fixed colour thresholds 65 / 145 / 185, red above range |
| Freshness steps everywhere | “x min ago”, “+0.1 mg/dL/min” (the user: not useful) |
| 0–3 time-in-range rings, windows 12 h – 14 d; wearer keeps 15 days (was 8); a reading store on the Mac | — |
| Windows: default + per place + per widget; per-widget settings on Android (Reconfigure) | the size-based widget windows (2–6 h by width); per-widget settings on macOS (App Intents: chronod never got the intent without an Xcode project and the widgets froze, removed in 0.11.8) |
--es graph, --es widgetGraph, cmd pinWidget in the DebugReceiver |
— |
Mac widget fixes after the release (0.11.9)
Section titled “Mac widget fixes after the release (0.11.9)”-
Gallery previews blank / old: the card is one image, and macOS redacts placeholder content, so the image came out blank (now
.unredacted()). macOS also kept its cached previews because the extension’s build number was always “1”;bundle.shnow stamps a newCFBundleVersionon every build, and chronod regenerates them. -
Monochrome / tinted widgets: the grid, the dashed 54/250 lines and the in-range band are drawn much fainter there (macOS turns the bitmap’s brightness into opacity).
-
Resets (0.11.9): each section of the graph settings has a reset that shows while it differs from the defaults (ranges, windows, slots and rings), plus Reset all graph settings; the Mac’s Graph submenu has Reset ranges and Reset all graph settings.
Lines, very good band and the cut-out (0.11.12)
Section titled “Lines, very good band and the cut-out (0.11.12)”The user, after using 0.11.11: a line at 100 and lines of their own, the very good range in a different colour from the rest of in range, and the distribution should cut the line under it instead of fading it: “if the distribution is close to 0 in a point, the line doesn’t get cut, but if it’s high it cuts the line earlier”.
- Lines:
GraphConfig.lines, default[100], up to 6 values in 40–400 mg/dL, drawn like the 54 / 250 lines. Android: Settings → Graph & time in range → Lines, as Material input chips (tap one to remove it, per the chip guidance: “Input: represents user-provided information … provide an X for removal”) plus a number field. Mac: Graph submenu → Lines (each line checked, pick it to remove it; Add line…), ordefaults write … lines "100,120". - Very good band: low…tight in the very good green (a little stronger), tight…high in the in-range colour (fainter). With very good up to = high the band is one colour, as before.
- The cut-out: a background-coloured stroke around the dots would show on transparent widgets and the lock
screen, so the lines don’t get one. The dashed level lines and the glucose line are drawn into their own layer
(
Canvas.saveLayer/CGContext.beginTransparencyLayer). Each row of dots is then erased from that layer as a pill 1.6 dp bigger than the row (BlendMode.DST_OUT/.destinationOut), and the layer is put down. Only after that are the dots drawn. The range bands stay underneath, uncut. A row with one dot cuts ~5 dp in, the longest rows ~25 % of the chart.
| Added | Discarded (why) |
|---|---|
Line at 100 + up to 6 custom lines (Android settings, Mac submenu, lines key) |
— |
| Very good part of the in-range band in its own colour | the single in-range band colour |
Extremely high (default 300, ≥ like the alert; Android slider, Mac bandExtremelyHigh): its own colour (magenta) for the line, the distribution and the number, and a dashed line with its value when the graph reaches it |
counting it as a sixth range in time in range, rings and the report (they keep LibreView’s five ranges; ≥ 300 counts as very high); a colour of its own in the status bar / menubar title (they only tell below / in / above) |
Vertical lines: off or every 1 / 2 / 3 / 4 / 6 / 12 h at least (Android slider, left end = off; Mac submenu; gridHours); small charts still space them further apart; the time labels stay |
the fixed automatic step only |
| The y axis always reaches very low / very high (the 250 line used to show only above ~220) | — |
| Distribution cut out of the lines below it (on any background) | the line fading towards the distribution (the user: looked bad where it overlapped) |
| The 54 / 250 lines run under the distribution too (cut like the rest) on Android | starting them after the distribution |
Treatments on the card: times, mute lines, badge, last treatment (2026-10-18)
Section titled “Treatments on the card: times, mute lines, badge, last treatment (2026-10-18)”The user’s feedback round: treatment units as 5g / 8u, how long ago each treatment was, how long its alert mute
still runs, what to do when out of range, and the last treatment beside the number. All of it follows the alert
rules through one shared, pure function (alerts/AlertStatus.kt: of() → None / Needed / Taken, muteUntil()), so
the chart, the badge, the slot and the alerts can’t disagree.
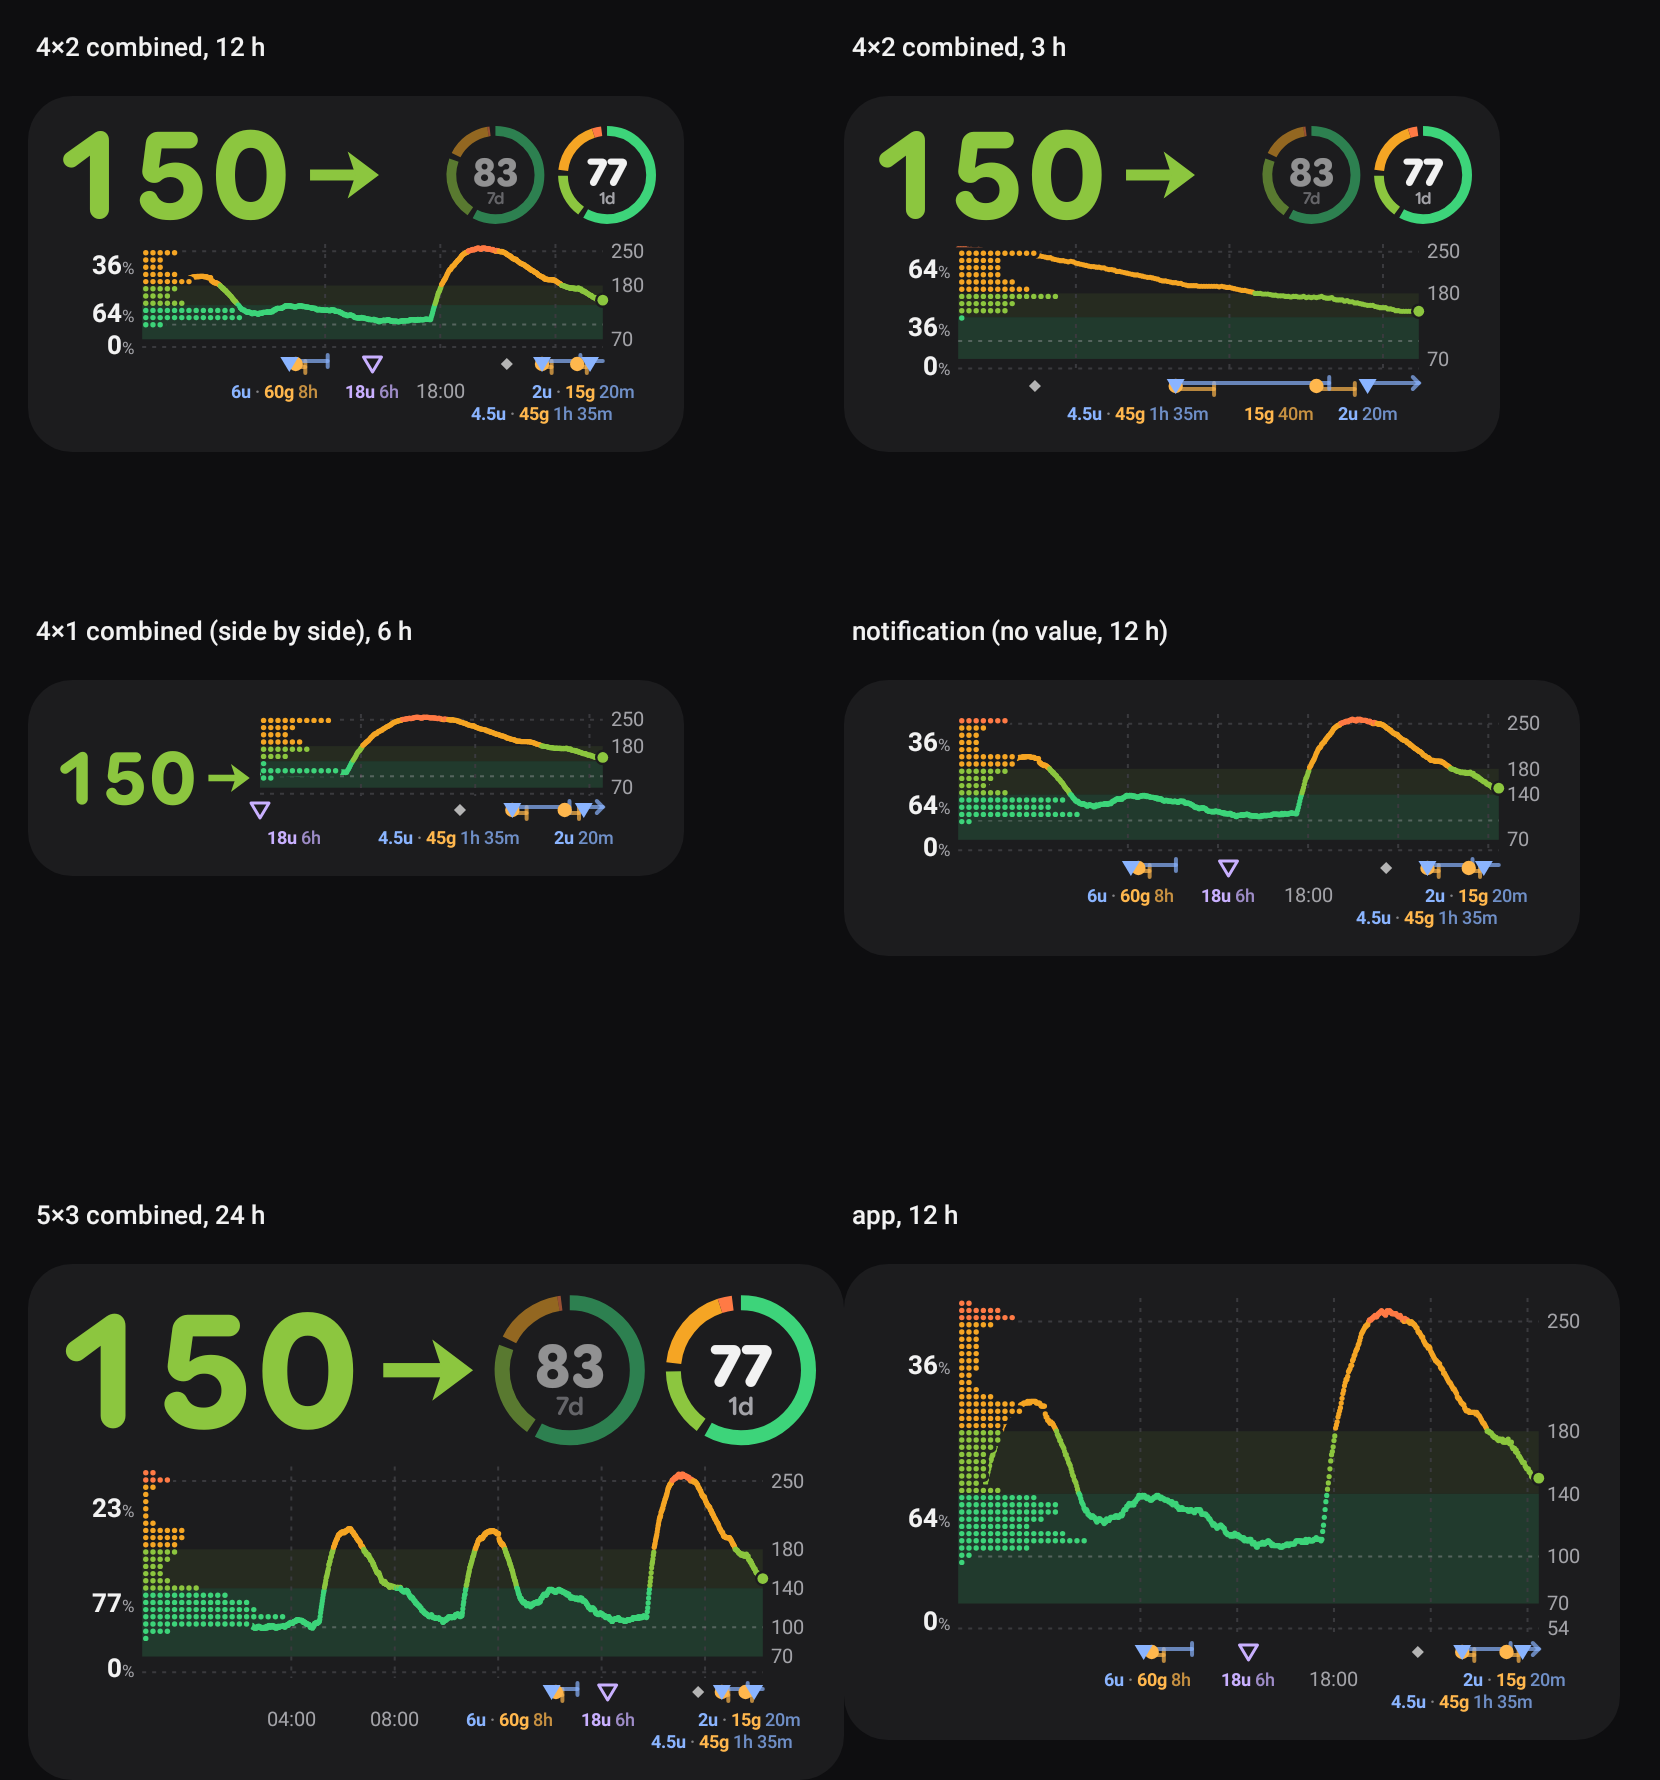
Marks: amount + time since (4.5u · 45g 1h 35m for a meal; labels under the markers since the
label layout), and a line from each rapid / carbs mark to the end of its
mute (60 / 15 min by default): a tick when over, a chevron at the edge while it lasts. At 12 h a 60-minute line is
short (~25 dp on a 4×2 widget); at 3 h it reads at a glance.
 |
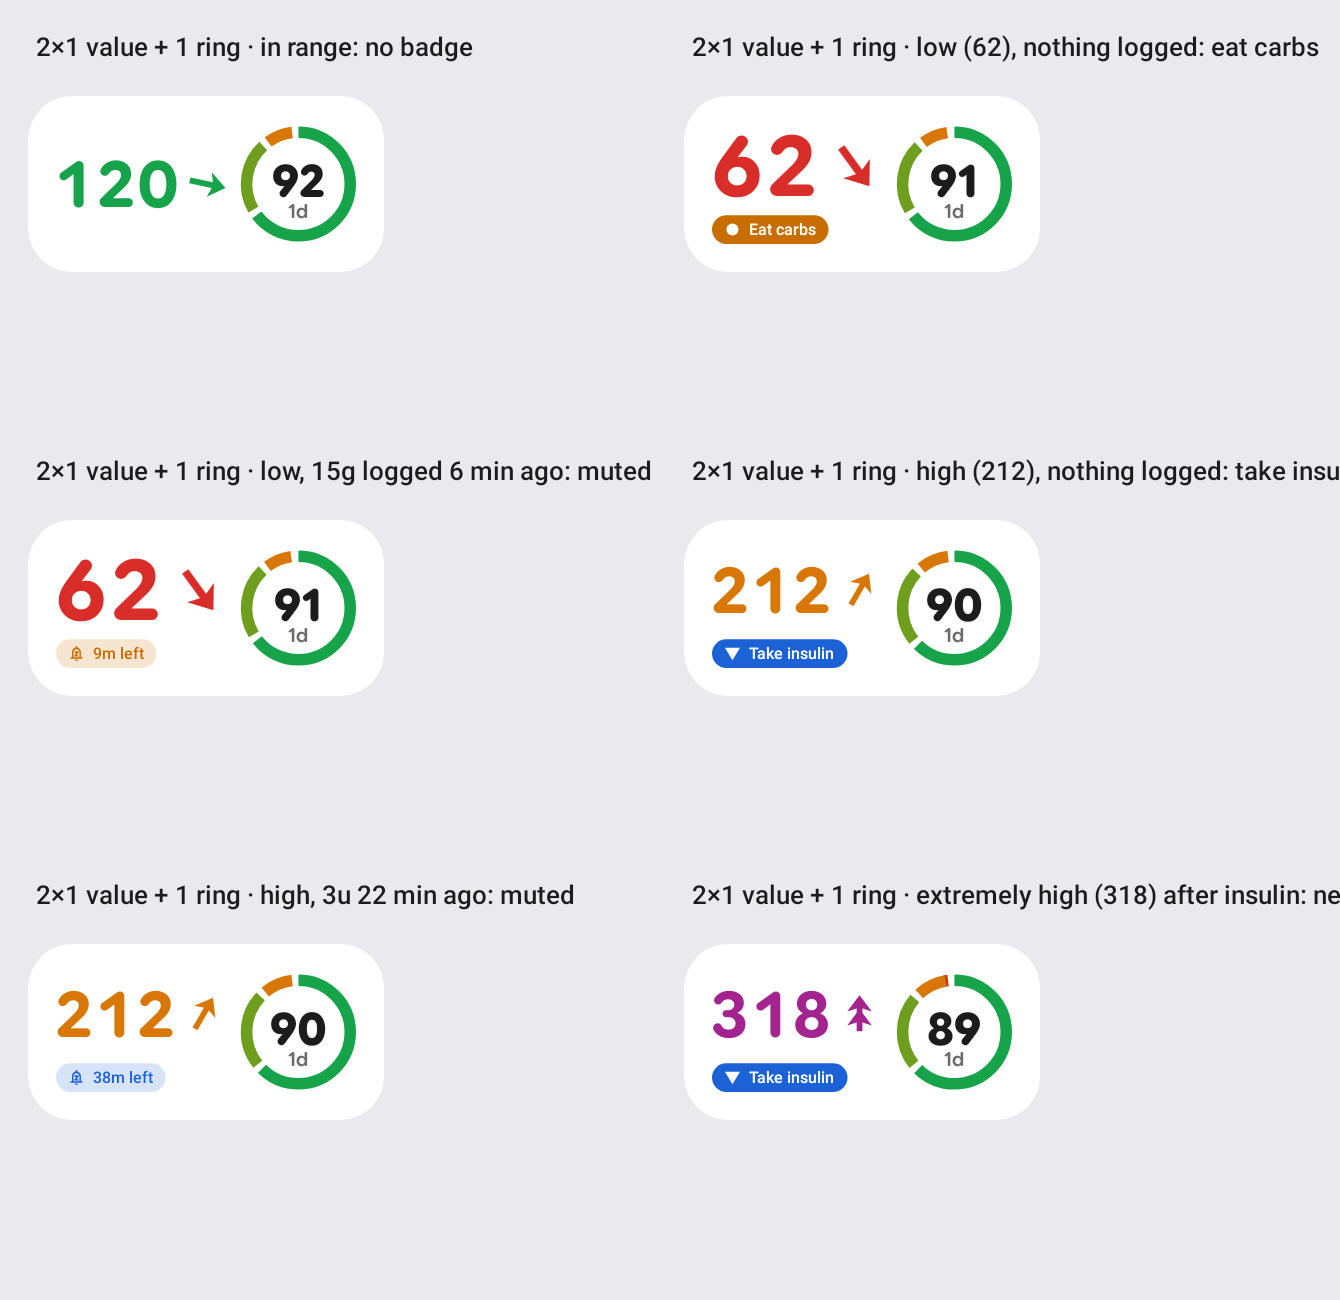 |
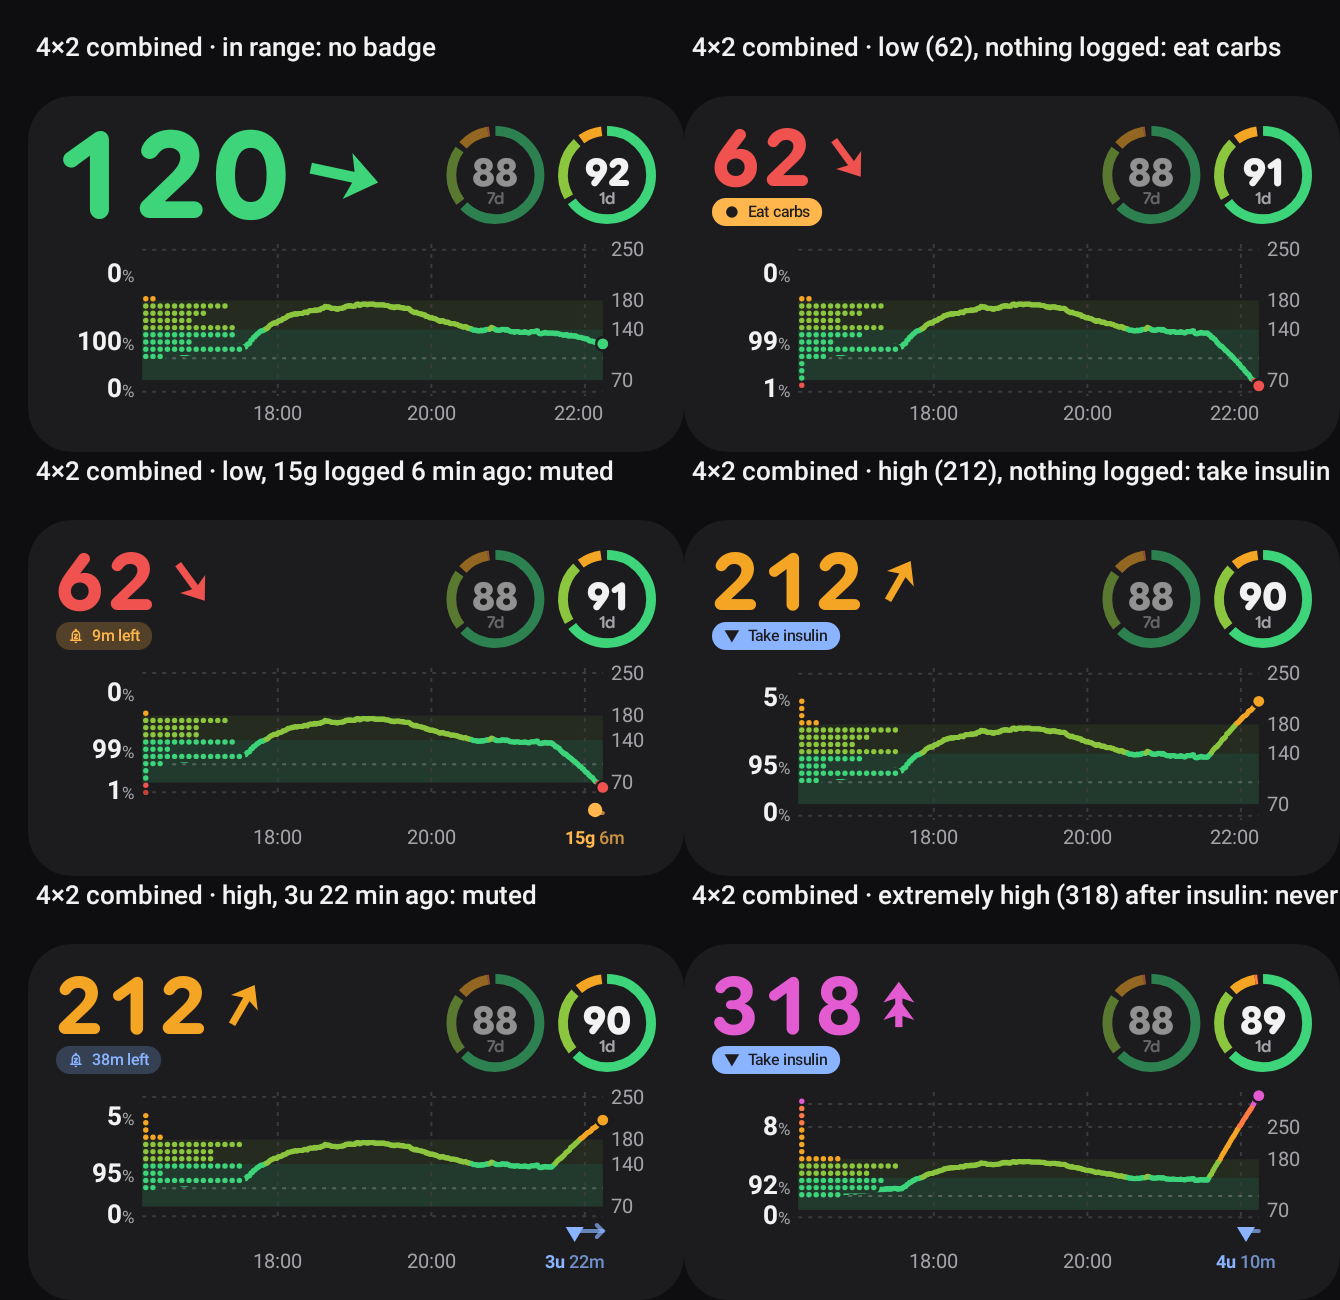
| Badge on a 4×2 widget: none in range; Eat carbs / Take insulin (filled); muted after a logged treatment (tonal, paused bell, time left); extremely high is never muted | 2×1 value widget, light |
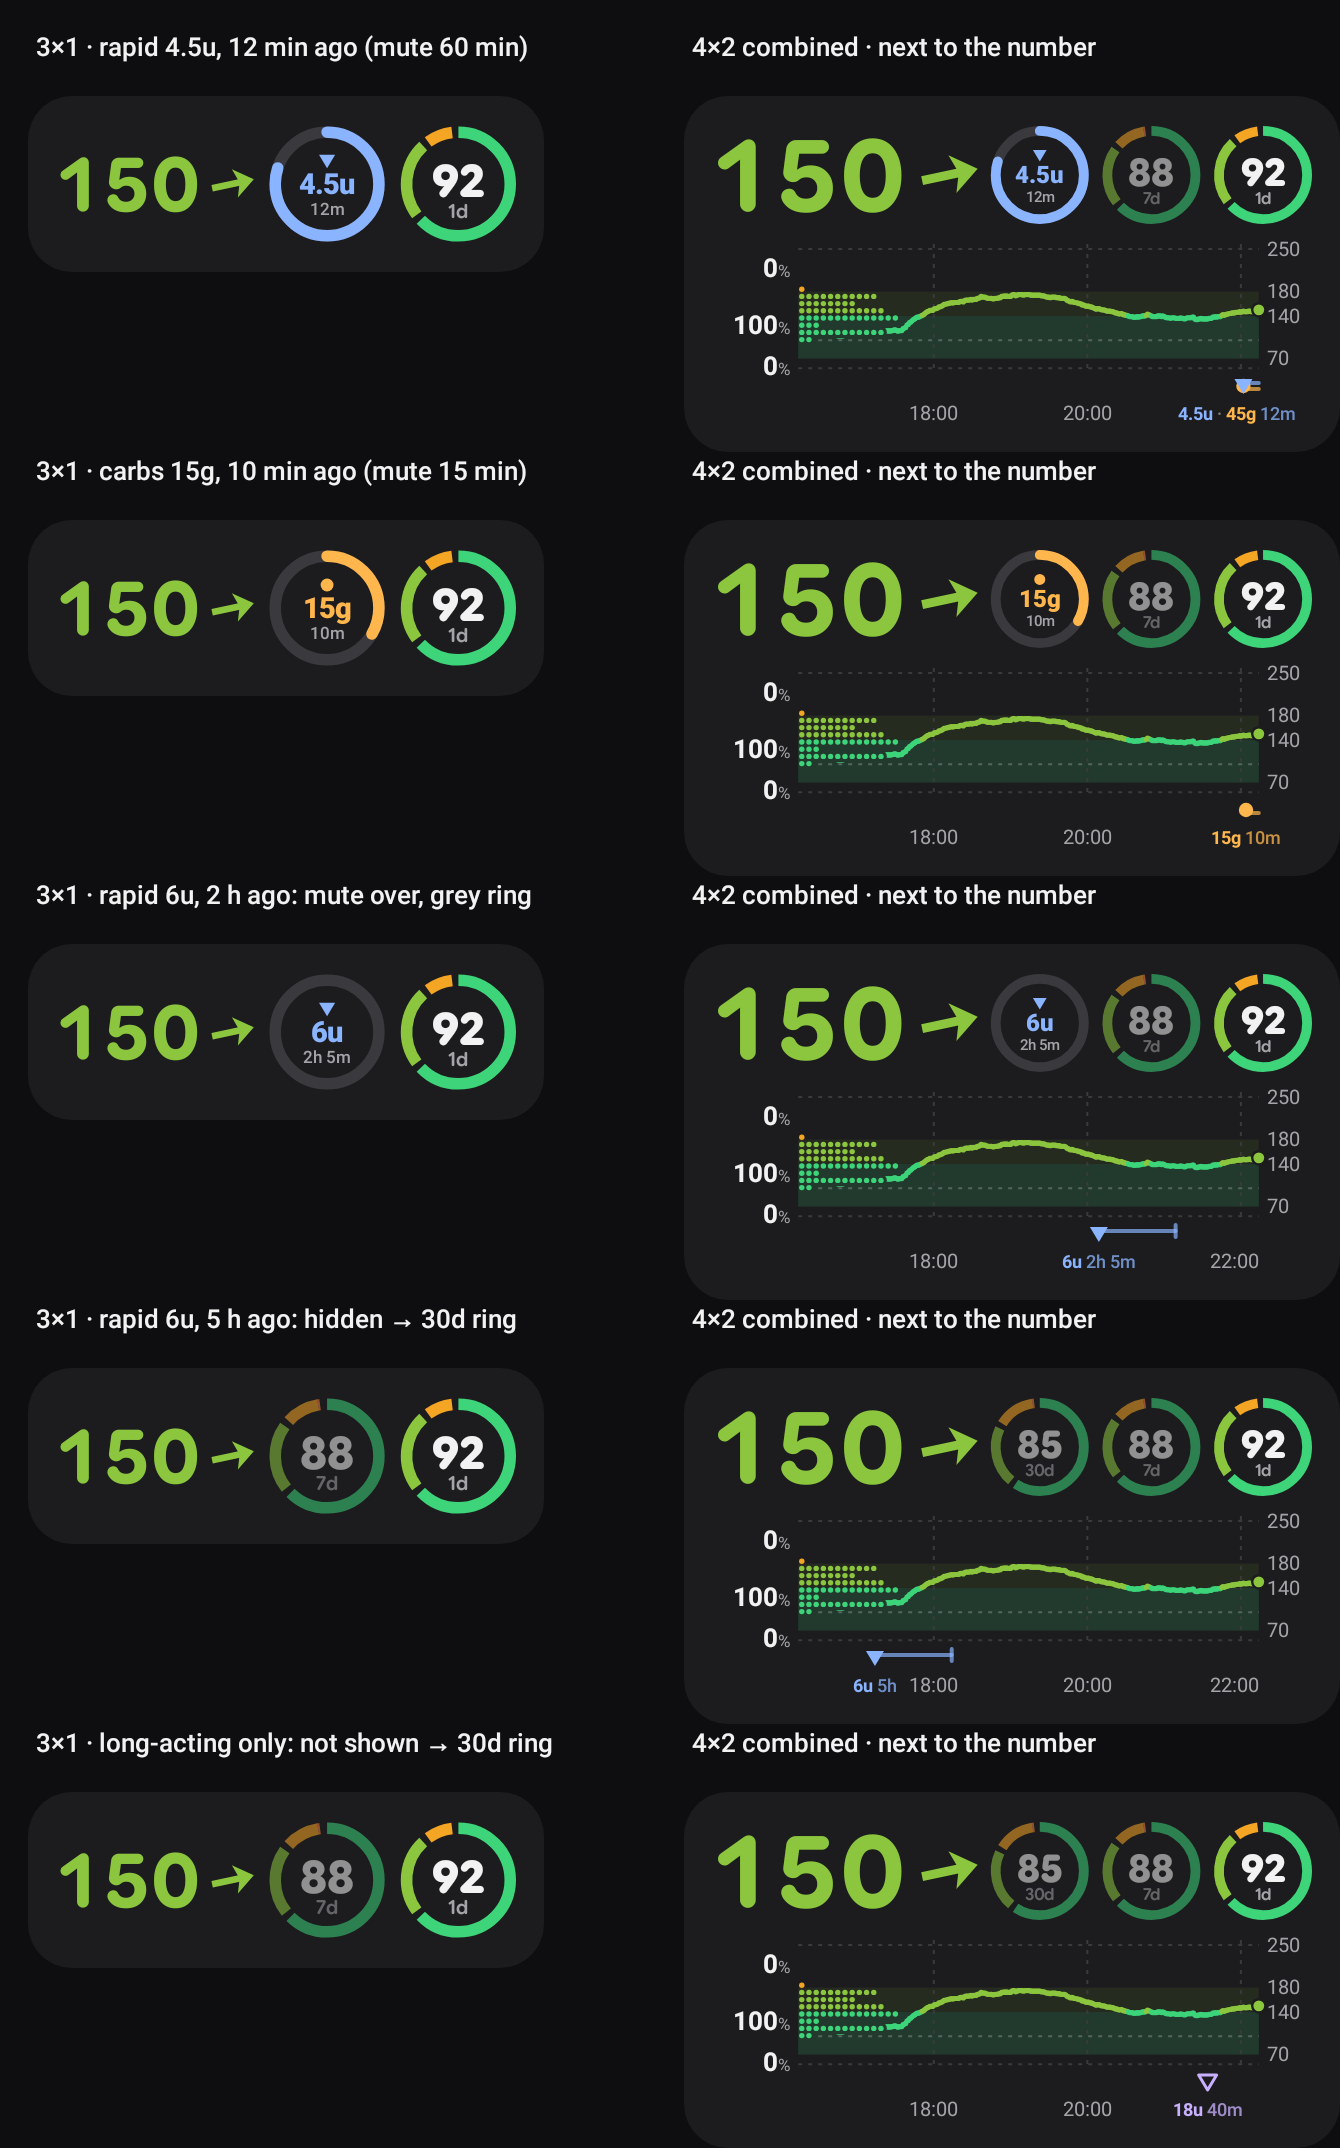
The last-treatment slot: rapid 12 min ago (ring 80 % of the 60-min mute left), carbs 10 min ago, rapid 2 h ago (grey: mute over), 5 h ago (hidden → the 30-day ring), long-acting only (never shown).
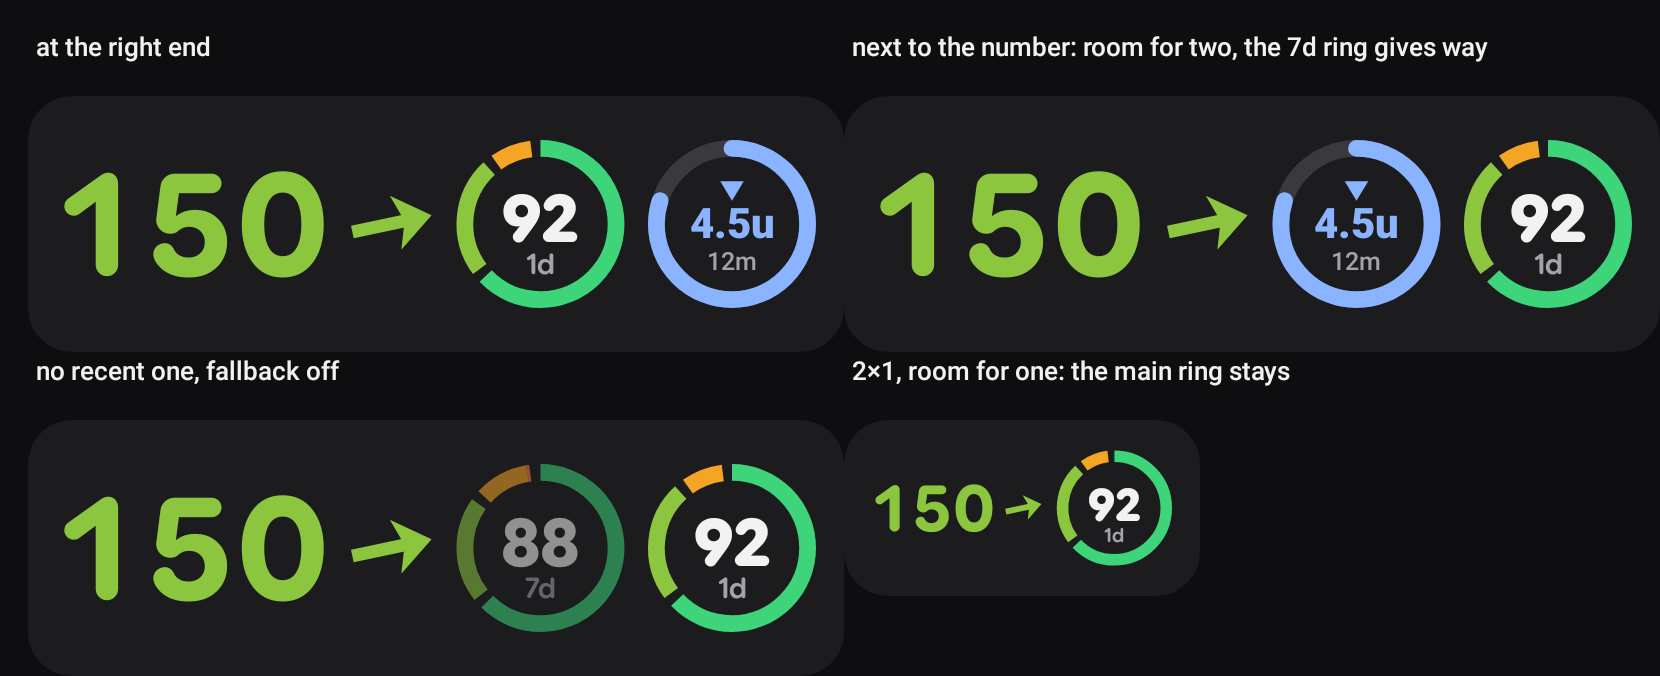
- Badge, not a Material badge (those are counts on icons) and not an assist chip (it isn’t an action): a status pill with the chip shape. Needed is filled (highest emphasis: act now); Taken is tonal, the Material 3 way to lower emphasis with colour instead of size (Material 3 in Compose: “Emphasis in M3 is provided using variations of color and its on-color combinations”). The bell is Material Symbols notifications_paused. Colours are the treatment kinds’ (carbs amber, insulin blue), so the badge, the mark and the slot of the same treatment match.
- Slot ring = a determinate circular progress indicator (“displays exactly how much progress has been made”, progress indicators) counting down the mute.
- How long the slot keeps a treatment: rapid insulin 4 h (rapid analogues act for ~3–5 h: the slot answers “is insulin still working?” and guards against stacking a correction); carbs 3 h (a meal is mostly absorbed in 2–3 h).
- Long-acting insulin is left out. It mutes nothing, and at one dose a day it would hold the slot all day, hiding every bolus and snack. A “basal taken today” check (a 24 h ring) is a different question; if wanted, it belongs in its own small indicator (e.g. a dot on the slot or a line in the notification), not in this slot.
- A setting with a place, not a slot kind. The user’s rings stay as they are; the treatment is one more slot that comes and goes. Priority when room is short: main ring → recent treatment → second ring → fallback → third ring, so where two slots fit a fresh treatment pushes the second ring out, the fallback only fills spare room, and a widget with room for one keeps the main ring.
Other places considered for the last-treatment info
Section titled “Other places considered for the last-treatment info”| Place | Verdict |
|---|---|
| Its own slot (built) | the right default: same size and language as the rings, its own ring counts down |
| Replacing the main slot | hides the user’s main ring exactly when glucose is moving; rejected |
| Under the value | taken by the badge, which already says “muted, 45m left” while a mute runs; the amount + time since would make it two lines |
| Notification | recommended next (owned by the notification work): the Taken badge’s words (“Alerts paused · 45m left”) fit the collapsed text; the expanded chart already has the marks and lines |
| Lock screen widget | gets the badge already (it draws the value through GlucoseCard); its slots are drawn by its own loop, so the slot needs Slots.arrange there (one call) |
| Mac menubar / widgets | ported in the same round (below) |
| Added | Discarded (why) |
|---|---|
Lowercase units without a space everywhere (4.5u, 30g) |
4.5 U, 30 g, 4.5U (the user) |
| Time since each treatment on the marks, the home list and the follower list | — (the “no x min ago” rule stays for glucose only) |
| Mute lines from rapid / carbs marks | lines for long-acting and notes (they mute nothing) |
| Status badge under the value (None / Needed / Taken) | a badge for no data (out of scope this round); a clickable chip (it’s a status) |
| Last-treatment slot with a fallback (default 30-day ring), placement setting | a new SlotKind (it would replace one of the user’s rings); long-acting in the slot |
| Carbs focused in the treatment dialog when low | — |
On the Mac (same round)
Section titled “On the Mac (same round)”SukraraGraph.swift ports the marks (times, mute lines), StatusBadge, Slots.arrange, LastSlot and LastPlace
line by line; AlertStatus and LastTreatment sit in poc/spikes/widgets-macos/Shared/AlertRules.swift with the
alert settings themselves, shared by the menubar app (its AlertEngine uses the same level, mutedBy and muteS)
and the widgets (the host writes its alert settings and the fallback ring’s numbers into the widget snapshot).
-alerts-selftest runs the CardStatusTest cases. render treatments <dir> (Render CLI) draws the gallery’s
marks, badge, last and last-places sheets with the same states, sizes and clock. (Here SF Pro being wider
than Roboto used to drop labels on the Mac that fit on Android; the label layout below decides on a width model
instead, so both platforms now place the same labels.)
Treatment labels: under the markers (2026-10-18)
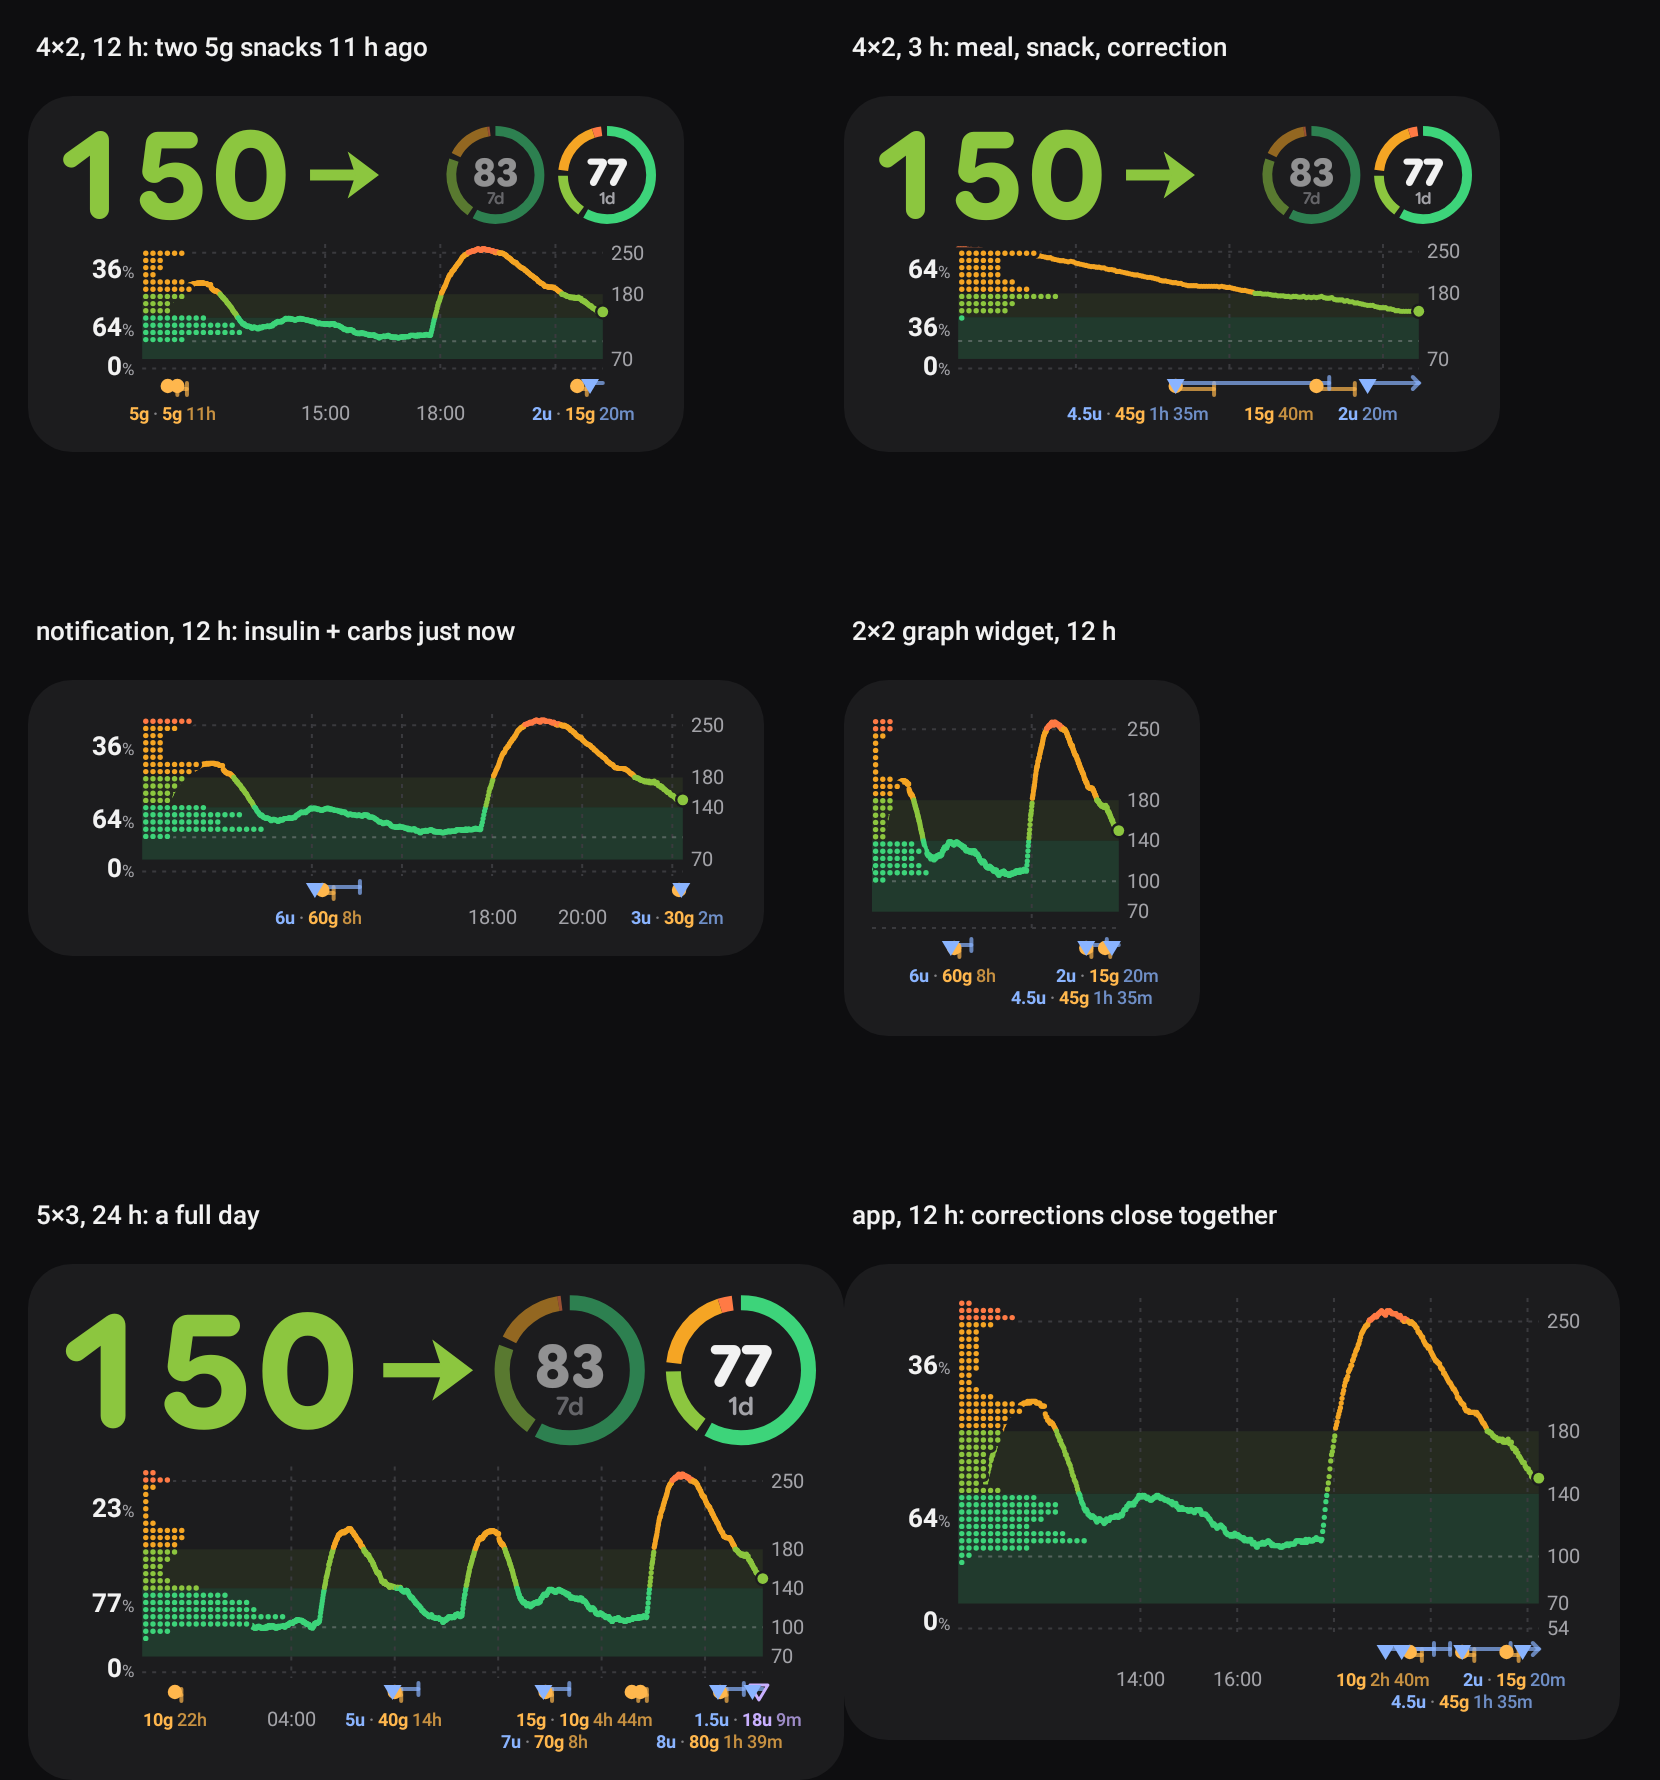
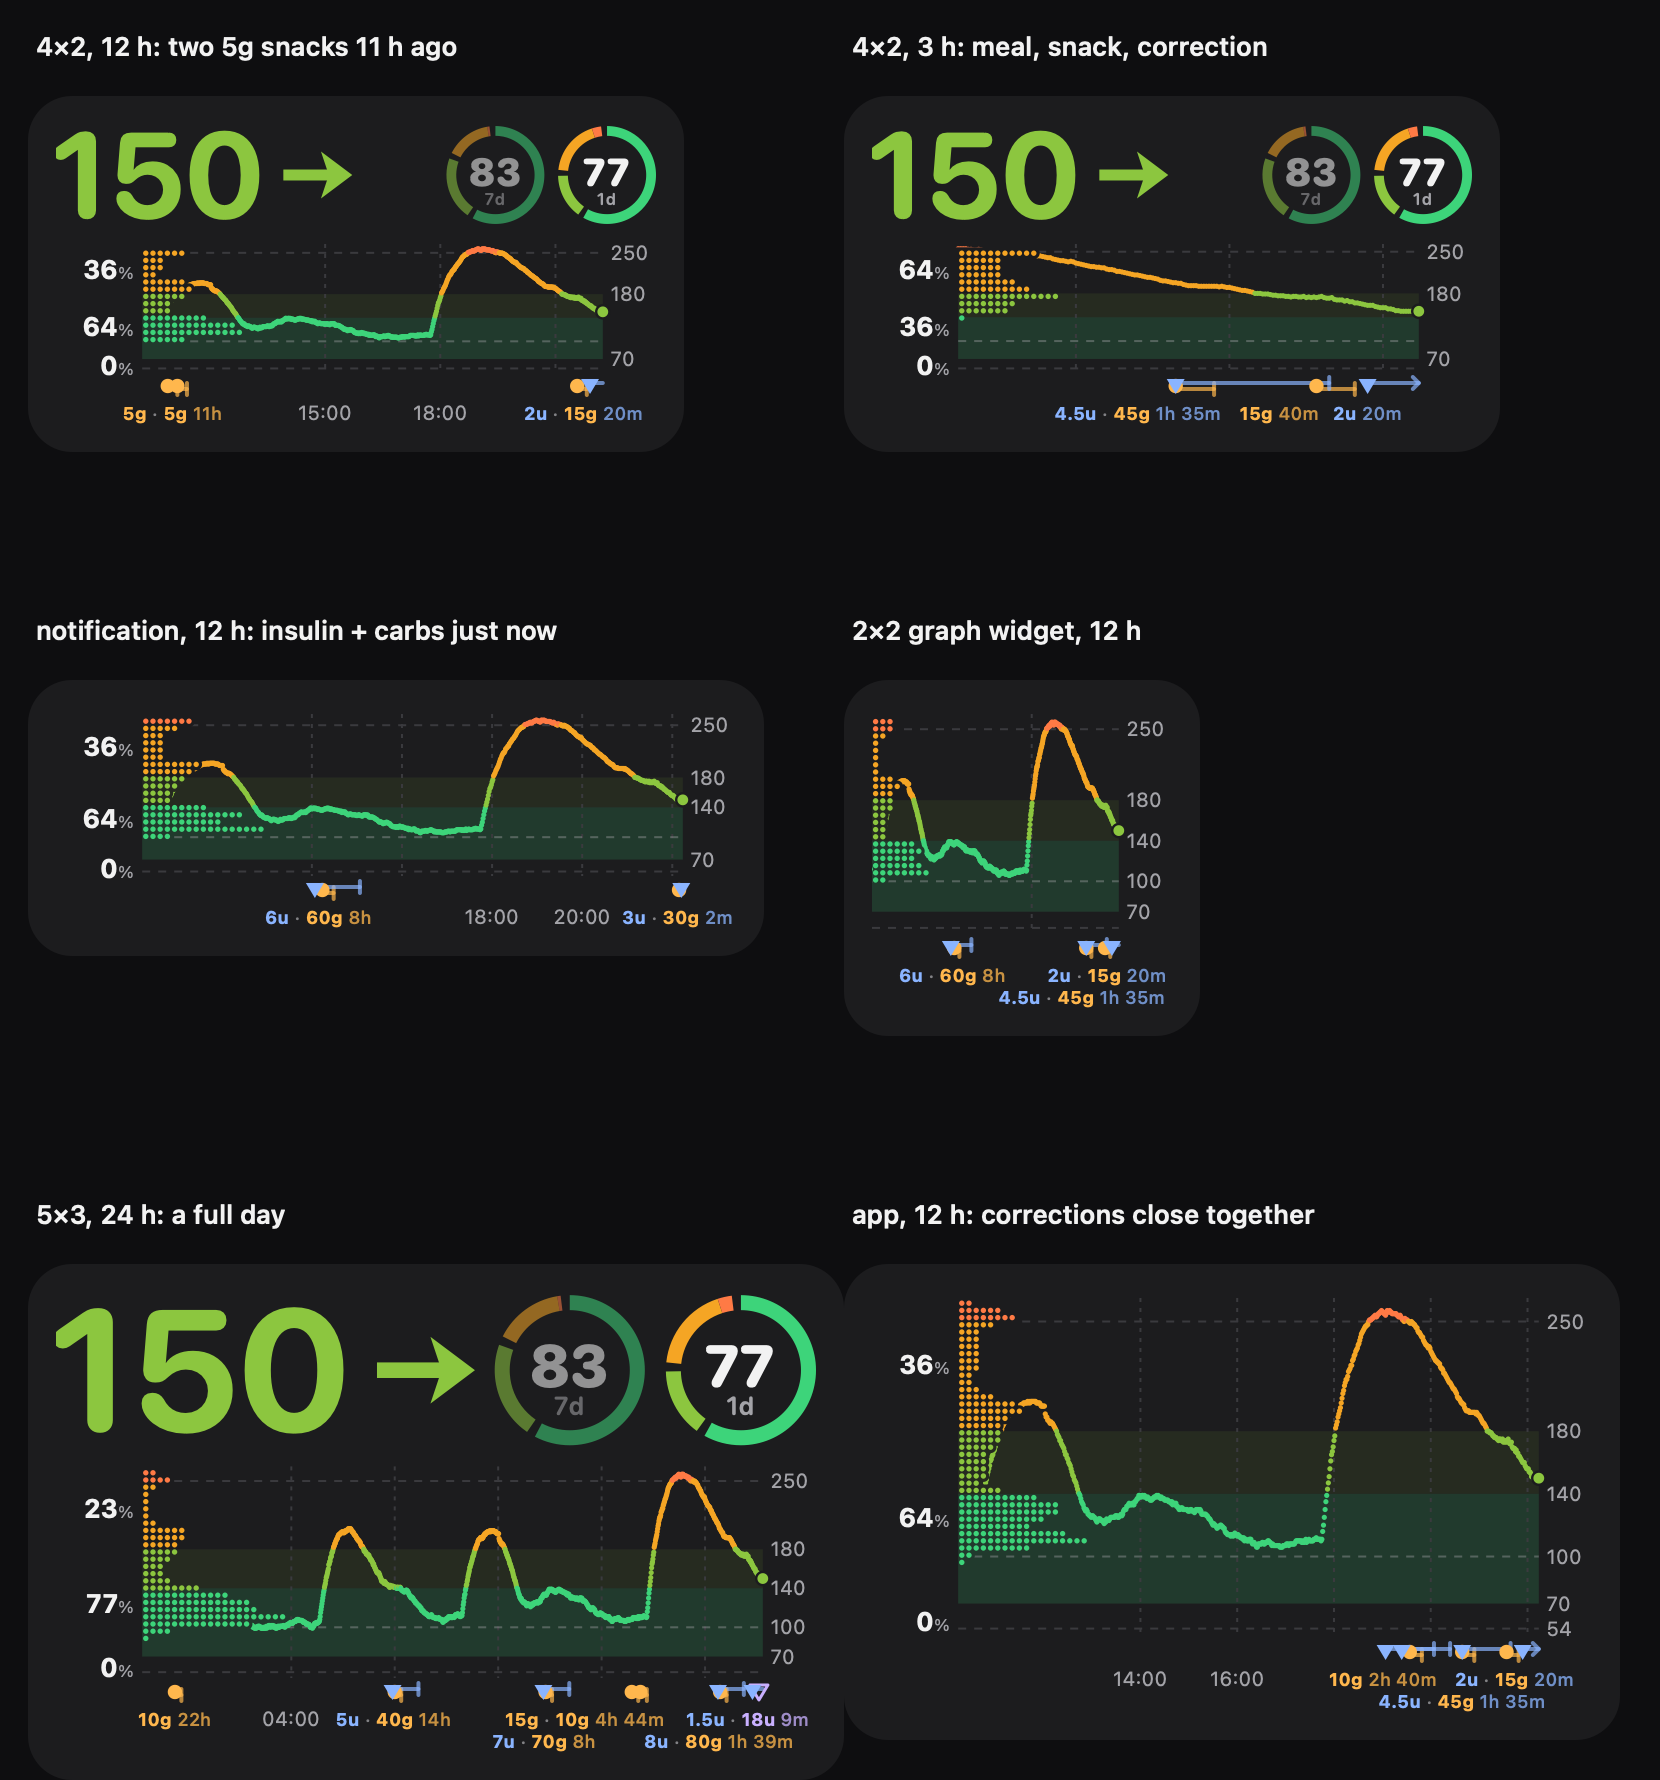
Section titled “Treatment labels: under the markers (2026-10-18)”The user, after using the marks: “the treatment labels cover the chart data. I prefer they show under the icon, and
that they cover the axis labels, which are less important”; they need an outline “otherwise when they overlap the
content under them they can’t be read well”; close treatments should be handled (the Mac showed two 5g 11h on top of
each other at the left edge); for every graph, Android and Mac.
 |
 |
Android (GraphGallery.marksClose) |
Mac (render treatments, mac-marks-close): the same labels in the same places |
Which parts show (2026-10-21). The user: “I don’t care about the carbs amount and time label (and also
line) … for each treatment I can decide to show or hide the point, the mute line, the amount label and the time
label”. MarkShow (both platforms; schema graph.marks, mirrored) holds per kind which of point / mute line /
amount / time show (carbs by default: the point only). The steps below run on what shows: in step 2 only entries with
their amount or time label shown take part; in step 3 a label holds the amounts that show and the time since the
newest member whose time shows (none when no member’s time shows); a label of times only has no “without the time”
fallback. The marker lane exists only when a point or a mute line is drawn.
Spec (Android TreatmentMarks.layout / place, Mac TreatmentMarks.layout / place)
Section titled “Spec (Android TreatmentMarks.layout / place, Mac TreatmentMarks.layout / place)”Units are dp, times seconds; the chart’s area is minX…maxX, the plot left…right inside it.
- Rows. Row 1 is the time axis’ row under the marker lane. Row 2 (11 dp, under row 1) exists only when the chart is at least 90 dp tall, and takes space (the plot shrinks by 11 dp) only when a label is put there. Nothing is ever placed over the plot.
- Groups. Entries with an amount (rapid, long-acting, carbs; notes keep only their marker), oldest first. One joins the previous group when it is ≤ 180 s after the group’s last entry (a meal: chained) or its marker is < 9 dp (a marker’s width) from the group’s first marker (not chained, so a run of snacks doesn’t become one label).
- Text. The group’s amounts in kind order (insulin, long-acting, carbs; then time), joined by
·, then the time since its newest entry:4.5u · 45g 1h 35m. Its anchor is the middle of its first and last marker. - Width.
TextModel.width(text, 9 dp): a per-character table in em (digits 0.72,./·0.38, space 0.3,m0.96, other lowercase 0.68, …), at or just above SF Pro Text Bold at 9 pt, the wider of the two fonts (Roboto’s digits are 0.56 em). Decisions never measure the font; the drawing centres the real text in the modelled box. - Order. Groups newest first. Each takes the first of these that has a free place: row 1 with its time, row 2 with its time, row 1 without it, row 2 without it. None: no label (its markers stay).
- Free place (
place). Preferred: centred on the anchor, kept insideminX…maxX(labels may run under the % column and the values on the right). The label may slide as long as the anchor stays ≥ 3 dp inside it (when that and the chart’s edge can’t both hold, only the preferred place counts; a label wider than the chart has none). Candidates in this order: preferred, the slide’s two ends, then for each label already in the row (in placing order) just right of it and just left of it; a candidate is free when, with 2 dp on each side, it overlaps no label in the row (4 dp apart; overlaps under 0.01 dp ignored). The free candidate nearest the preferred place wins, the first one on a tie. - Axis labels give way. An hour label whose box ± 3 dp touches a row-1 treatment label is not drawn.
- Halo. The whole chart is drawn in one layer (Android
saveLayer, MacbeginTransparencyLayer, 6 dp wider than the area so a marker at the edge isn’t clipped). Each label’s outline, 3 dp wide with round joins, is erased from it (DST_OUT/.destinationOut) before the text is drawn. Unlike a stroke in the background colour this is right on every surface: the card, transparent Android widgets, the lock screen, the colorized notification, the Mac’s material panel and tinted Mac widgets — so it is used everywhere, not only on the transparent ones. - Side columns (
plotX): each is the widest label actually drawn, measured with the drawing font, plus 3 dp on each side (SIDE_GAP_DP/sideGap): the % column (13 dp bold number + 8.5 dp%, right-aligned) and the values on the right (10 dp, left-aligned; the values written, which depend on the plot’s height, which depends on the second treatment lane, which depends on the width: the renderer starts from every candidate value and settles on the written ones in one or two more rounds). 2026-10-21: sizing them by the model left 9–11 dp left of the % labels and 5.6 dp right of the values on Android, whose digits are much narrower than the model’s 0.72 em. So the plot’s edges differ by a few dp between Roboto and SF Pro; the label fixtures use the file’spctLabel(37 dp) andvalueLabel(20.6 dp) for the columns’ labels.
At a large system font (#70): the labels’ size (and the rows’, the side columns’ labels) is 9 dp × the chart’s
text scale, the system font scale capped to 1…1.3; the merge distance, gaps and the 90 dp second-row threshold stay in
dp. The labels fixtures carry cases with fontScale 2.
Why not more rows or leader lines: two rows already take 25 dp of a 4×2 widget’s 93 dp chart; a third would take the plot’s room, and a leader line would cross the marker lane’s mute lines.
Fixtures (the layout dump)
Section titled “Fixtures (the layout dump)”poc/spikes/graph-fixtures/labels/labels.json: 10 cases (two 5g snacks 11 h ago at the left edge, a meal with insulin
and carbs in the same minute, insulin + carbs 2 and 5 min ago at the right edge, a 2×2 graph widget without the %
column, a full 24 h day, a one-row 4×1 side-by-side chart, corrections close together with a note, a snack every
40 min, a label squeezed between the left edge and a newer one (drops its time), a lone bolus with no time in range
yet). Each expects the plot’s edges, the number of rows, every label (entries, text, row, centre in dp from the
chart’s left, ± 0.5) and the groups left without one. Android GraphFixtureTest.labels and the Mac’s
-graphselftest read the same file: 10/10 on both. The Mac also checks that SF Pro’s real width of every fixture
label fits its modelled box (the font that could break it).
Rounded numbers (2026-10-18)
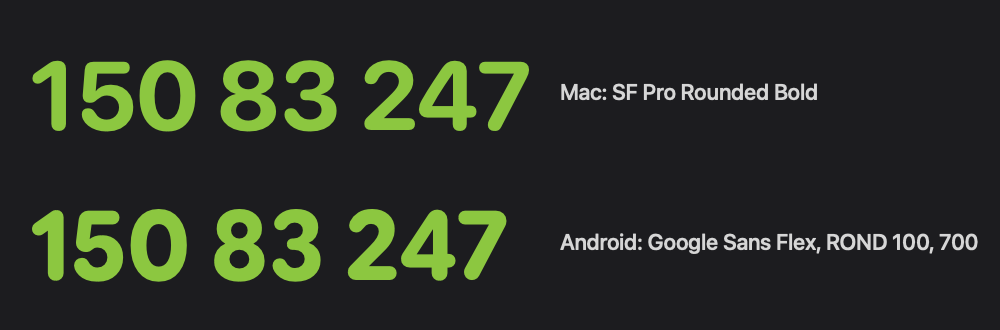
Section titled “Rounded numbers (2026-10-18)”The user: “On Mac I like the round font on the graph’s big numbers, can’t we have a similar one on Android?” The Mac draws them in SF Pro Rounded (value bold; the ring and slot numbers and their window labels semibold: a slot’s number heavier than the value read as a second reading, #70).
| Option | Verdict |
|---|---|
| Google Sans Flex, roundness axis at 100 | chosen. Google’s own variable face (google/fonts ofl/googlesansflex, SIL OFL 1.1, no Reserved Font Name) has a ROND axis (0–100); at 100 its digits are the closest to SF Pro Rounded (same rounded terminals, similar proportions, a touch heavier) |
| Nunito, M PLUS Rounded 1c | rounded too, but rounder / softer digits than SF Pro Rounded; not needed once Google Sans Flex was available |
| a downloadable font (Google Play services) | widgets, the notification and the lock screen are drawn on a plain Canvas in the background; a bundled file is simpler and always there |
The 3.9 MB variable font is instanced with fontTools at ROND 100, opsz 18, wdth 100, slnt 0 and weights
600 / 700 / 800, each subset to Basic Latin, a few accented letters and –, −, ·, … (~33 KB each, ~100 KB in
all), in assets/fonts/ next to OFL.txt. Used for the same texts as on the Mac: the value (700, proportional figures like SF Pro Rounded)
in the widgets, the lock screen and the app panel’s rolling digits (Compose FontFamily(Typeface)), the ring and
slot numbers and their labels (600; 800 until #70). The notification’s value is a TextView in RemoteViews, which
can’t use an app font (the system inflates it with a restricted context), so it is now drawn as a picture in the
same face (with the number as its content description). The last-treatment slot keeps the system face, as on the
Mac.
| Added | Discarded (why) |
|---|---|
| Treatment labels under the markers, in the time axis’ row (hour labels give way) and a second row when needed | labels above the markers inside the plot (they covered the line); a stroke in the background colour (wrong on transparent / tinted surfaces) |
| Close entries share a label (meal ≤ 3 min, or markers < 9 dp apart), labels slide to keep their marker inside, newest first, time dropped before the label | chained pixel merging (a run of snacks became one label wider than the chart) |
| A width model shared by both platforms + label fixtures with a layout dump on both | measuring each platform’s font (SF Pro dropped labels that fit with Roboto) |
| A halo on every label, cut out of the chart | — |
| Rounded numbers on Android (Google Sans Flex, ROND 100), notification value as a picture | Nunito / M PLUS Rounded (further from SF Pro Rounded) |
Value and rings: the number shrinks, never the ring (2026-10-18)
Section titled “Value and rings: the number shrinks, never the ring (2026-10-18)”The user, after the rounded numbers: “the main time-in-range ring is smaller than it should be … the number should
be the one shrinking”, and “the letter spacing on the big glucose numbers is too much” (Android only). Both came from
the value’s tabular figures: in Google Sans Flex every digit is 0.66 em wide with tnum (proportional: “1”
0.42, “8” 0.59), so “188” grew from ~121 dp (Roboto) to 143 dp at 72 sp. The app panel guessed the value at 188 dp
and laid the row out as value → spacer → 68 dp slots; Compose measures the row’s children in order, so the last one,
the main ring, got what was left (56 dp on a 1080 px / 420 dpi phone).
- Android’s value is in proportional figures again (app panel, widgets, lock screen, notification), as on the Mac.
- App panel (
ValueAndSlots,graph/ValueFit.kt): the slots are fixed (requiredSize68 dp) and the value is the row’s only flexible child. The value is measured in the real face (the wider of the reading and “388”, so it doesn’t change size between 99 and 188), shrinks down to 75 % (54 sp) and only then the lowest-priority slot goes (Slots.arrange); the main ring always stays. - Notification: the slot count comes from the measured value instead of a 110 dp guess.
- Widgets, lock screen and the Mac (menubar + widgets) already worked this way: their rings are sized from the card’s height and the number fits the rest, so nothing changes there.
Guards: ValueFitTest (plain JVM, the bundled font’s digit widths: “388” ↗ at 296 / 347 / 411 dp, font ×1 / 1.3 / 2)
and ValueRowTest (Robolectric: the panel’s slots measure 68 dp at 347 and 296 dp with “188” / “388” ↗; the canvas
card’s main ring is pixel-identical with “388” ↗ and “68” → at 2×1, 3×1 and 4×2; writes the value-row sheet).
| Added | Discarded (why) |
|---|---|
| proportional figures for the value on Android | tabular figures (wide gaps around “1”, and the value outgrew the row) |
| a measured value width in the app panel and notification, value shrinks before a slot goes | the fixed 188 dp / 110 dp guesses (wrong as soon as the face changed) |
One sensor-badge placement for every surface (2026-10-21)
Section titled “One sensor-badge placement for every surface (2026-10-21)”The 0.11.33 move of the sensor’s time left under the % column reached only the cards that draw value and chart in
one GlucoseCard.draw with a % column: the app panel (Compose value + its own GlucoseGraph.draw), the lock screen
(two GlucoseCard.draw calls with different styles), graph-only widgets and the notification kept the old place or
none. Now the placement is one decision, GlucoseCard.sensorSpot, over the whole card’s style:
- a card with a labelled chart puts the badge at the start of the hour labels’ row (left edge, under the % column and the distribution; with no % column the same corner), hour labels start after it, treatment labels keep its box free;
- a card without one (value widgets, time labels off) puts it beside the arrow, and the number shrinks to make room;
- surfaces that draw a card in boxes of their own pass the same whole-card
CardStylewithpart(CardPart); - the place’s setting (Sensor time left, per place and per Android widget) is part of the style.
Guards: poc/spikes/graph-fixtures/place (both platforms decide the same; the box and the label room in the TextModel),
two label cases with the badge’s room, and tools/check graph-surface (whole tree): only GlucoseCard draws the chart
and the badge, every surface CardStyle carries sensorTime, a file drawing a card in parts passes part each time,
the Compose badge only next to GlucoseCard.sensorSpot. The gallery’s surfaces sheet (Android) and render treatments
mac-surfaces (Mac) draw every surface with the same data.
The last-treatment slot in the same round: carbs logged while rapid insulin’s mute runs share the slot as an inner ring
(8u over 5g), on slots ≥ 40 dp across; smaller ones keep the insulin alone.
| Added | Discarded (why) |
|---|---|
| One placement rule for every surface, the badge in the chart wherever a labelled chart is shown | a % column condition and a fallback beside the arrow when a treatment label sat there (the place depended on the data, and split surfaces couldn’t know it) |
| Treatment labels keep the badge’s box free | the badge giving way to a label (it would jump between places) |
| Sensor time left per place / per Android widget | one global switch (every other graph setting is per place) |
| Concentric insulin + carbs slot (two values inside) | both values in one ring segment (unreadable); the time since in the pair (no room; the single slot keeps it); the pair on slots under 40 dp (text under ~7 dp) |
Scrolling through time and a wider cut-out (2026-10-21)
Section titled “Scrolling through time and a wider cut-out (2026-10-21)”The user: “I would like to be able to scroll the graph … The distribution would update live — it’s about the data being shown. There should be a button to go back to now … natural native scroll and no weird physics. Graph scale should also update”, and “more outline so it masks out more of the content behind”.
Added.
- The renderer takes the window to draw (
ChartView: its end, the y range and the plot’s bottom while the surface eases them, the Now pill’s visibility), so the one card renderer stays the only thing that lays the chart out; a surface that scrolls only owns the gesture and the easing. Everything on the chart follows the window: the line, the distribution and the % column, the y range (GlucoseCard.yRange, the same 54 / 250 rules), the hour labels, the treatment marks; the slots and the value stay about now. - Android app panel:
scrollableAreawith aScrollableState(developer.android.com, “Scroll”: the modifier the Compose guidance names for custom scroll containers; it brings the platform’s fling decay and the stretch overscroll and lets the vertical page scroll keep vertical drags). The whole stored history loads (off the main thread) the first time the chart leaves now. The y range and the plot’s bottom ease with a critically damped spring at the spatial spring’s stiffness (a bouncing scale reads as the data moving); the pill fades with the effects spring. - Mac dropdown:
scrollWheelwith the system’s own momentum events (what NSScrollView follows), axis-locked per gesture so vertical swipes stay the panel’s; a wheel scrolls the chart like a horizontal-only scroll view; a display link eases the y range, the plot’s bottom, the pill and the way back to now. The dropdown opens at now again. - The Now pill is the card’s action pill (
StatusBadge, kindnow, neutral colour, Materialarrow_forward/ SFarrow.right), drawn by the renderer at the plot’s top right; the surfaces make its box tappable. - The distribution’s erased outline went from 1.6 to 3 dp around the dots; the value lives in
layout/rules.jsondistributionand both test suites check the constants and every drawn outline against it. - Tests:
layout/scenes.jsonscroll(a scrolled chart equals the chart of the visible data alone; y range = the visible readings’; pill only when scrolled; shared font-independent answers), the tap / drag inCardLayoutTest,ChartScrollPerfTestand the Mac self-test’s frame timing (31 / 15 days of 1-minute readings: ~3 ms per scrolled frame on the JVM, ~2.7 ms for the whole Mac card in a release build);GlucoseStats.windowcuts a sorted history by binary search and the distribution no longer builds per-band lists, so a frame touches only its window.
Left out.
- Widgets, the notification, the lock screen and the Mac widgets don’t scroll: the system shows them as pictures (RemoteViews / WidgetKit) without gestures.
- An NSScrollView document view on the Mac: the scroll events already carry the system’s momentum, and a document as wide as two weeks of chart would only stand in for a number.
- Easing the % column’s width: it changes only when a window reaches 100 % (three digits), rarely while scrolling.
- The second label lane still switches with the labels in the window (the labels move 11 dp); the plot itself eases.
- Emulator frame stats as the performance measure: the shared emulator was saturated (its own vertical page scroll measured 100 ms frames), so the numbers above come from the renderer timed on the JVM and on the Mac.
Zooming the time axis (2026-10-21)
Section titled “Zooming the time axis (2026-10-21)”The user: “can we make that in the scroll feature it can also zoom in and out the x axis with pinch gesture?”, then “24h max limit is too low. vertical lines and axis labels should adapt”.
Added. ChartView carries the window’s length; the renderer draws it like any window. Android: a pointer handler
before the scroll’s takes two-finger events only (the Compose multi-touch guidance’s calculateZoom /
calculateCentroid / calculatePan, developer.android.com/develop/ui/compose/touch-input/pointer-input/multi-touch),
zooms the x axis at the centroid, moves with the centroid and consumes them, so the scroll’s drag and fling don’t run
too. Mac: magnify(with:) and ⌘-scroll at the cursor. Limits: 2 h (the hour labels stay at least two) to the whole
history, at most 31 days. The lines’ step continues past 12 h into 1, 2, 3 days and a week, fixed to the calendar
(midnights, day numbers, Mondays) so they don’t move while scrolling, with date labels. Far out the line becomes 1 dp
columns (lowest to highest reading, split by band). The Now pill also resets the zoom; the zoom never outlives the
screen / the dropdown.
Left out. Sub-hour steps (the user’s grid setting is whole hours, and 2 h already shows two labels); a vertical zoom (the y range stays the window’s own); keeping the zoom across visits (the user’s place setting is the default).
- macOS per-widget settings would need an Xcode project (so the App Intents metadata is registered properly).
- The old in-app chart animations (new points growing in) are gone; the number still rolls and the arrow still turns.
- The doctor-report metrics (average glucose, GMI, CV, goals): 18.